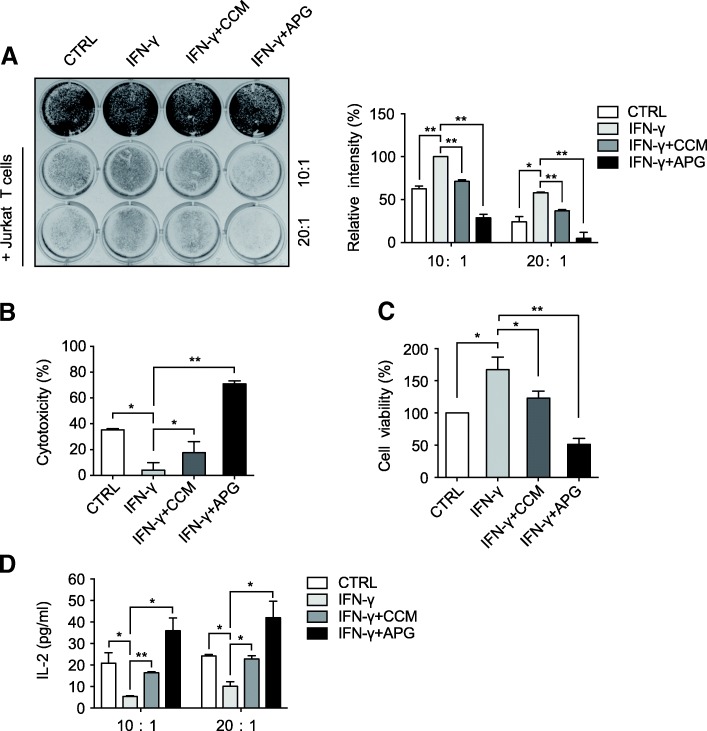
Fig. 5.
The effects of flavonoids in Jurkat cell-mediated A375 killing assays. a A375 cells were treated with DMSO, curcumin, or apigenin in the presence of IFN-γ (10 ng/ml) for 24 h, before cocultured with activated PD-1 expressing Jurkat T cells with effector to target ratios of 10:1 and 20:1. After 72 h of incubation, surviving tumor cells in 12-well plate were stained by crystal violet and imaged. Relative intensities of surviving cells are shown in the right chart, with IFN-γ-treated sample (10:1 group) set to be 100%. b and c cell killing assays were set up as described above in a 96-well plate. The cytotoxicity of T cells against A375 cells at an effector to target ratio of 10:1 was analyzed using an LDH detection assay kit (percentages calculated as per kit instruction) and remaining cell viability was assessed by MTT assay (control sample set to be 100%). d secreted IL-2 from Jurkat-mediated A375 killing assays was measured using supernatants from cocultures by an IL-2 ELISA kit. Data are represented as mean ± S.D. (n = 3, *P < 0.05 and **P < 0.01)

