Fig. 6.
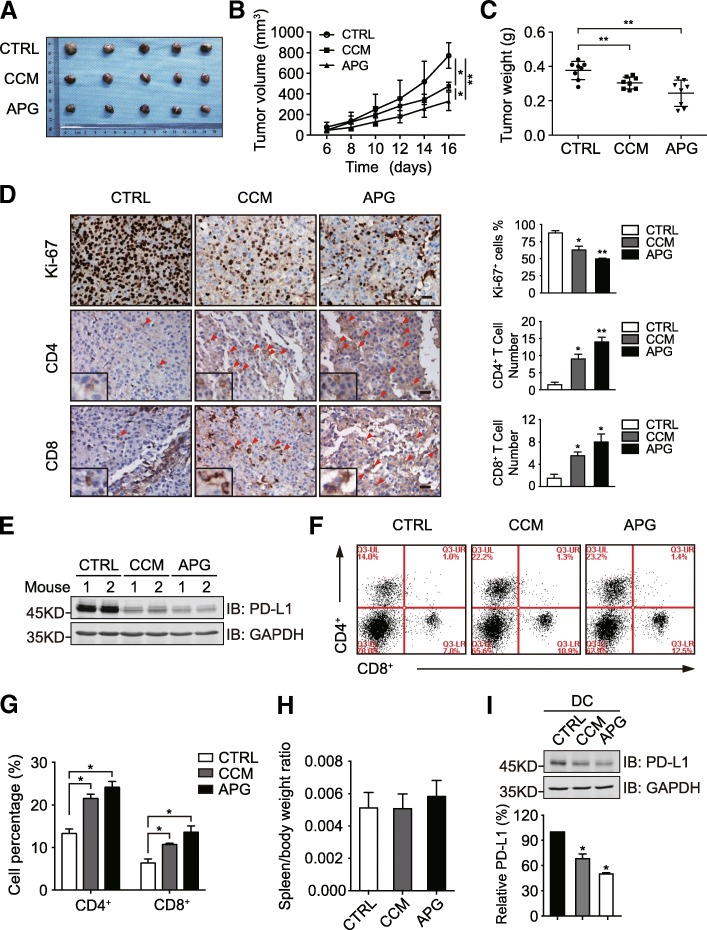
The influence of apigenin on B16-F10 melanoma xenograft tumor growth and host T cell immunity. a B16-F10 melanoma cells were subcutaneously inoculated into female C57BL/6 wild-type mice. After 4 days, xenograft-bearing mice were randomly divided into 3 groups to receive saline (control), curcumin, or apigenin by daily oral gavage for 12 consecutive days, before sacrifice and tumor resection. b B16-F10 xenograft tumor volume was measured every other day during the treatment and plotted. c the weight of resected B16-F10 xenograft tumor was measured and plotted. d tumor tissue sections were analyzed by immunohistochemistry using anti-Ki-67, anti-CD4, and anti-CD8 antibodies. Scale bar = 50 μm. Magnified insets show CD4 or CD8 positive stained cells. e tumor tissues were lysed to detect PD-L1 expression by immunoblotting. GAPDH was used as a loading control. f splenocyte preparations from different groups were analyzed by flow cytometry with CD4 and CD8 antibodies. g the quantitation of CD4 and CD8 positive cells from different treatment groups in F (total population as 100%). h spleen/body weight ratios of mice with different treatments. i C57BL/6 mice with 3 groups were treated by oral gavage with saline, curcumin (50 mg/kg), or apigenin (150 mg/kg) once a day for 2 weeks. DCs were isolated from mouse spleens and PD-L1 expression in DCs was then detected by immunoblotting. Bar chart shows relative quantification of PD-L1 levels (control as 100%). GAPDH was used as a loading control. Data are presented as mean ± S.D. *P < 0.05, **P < 0.01

