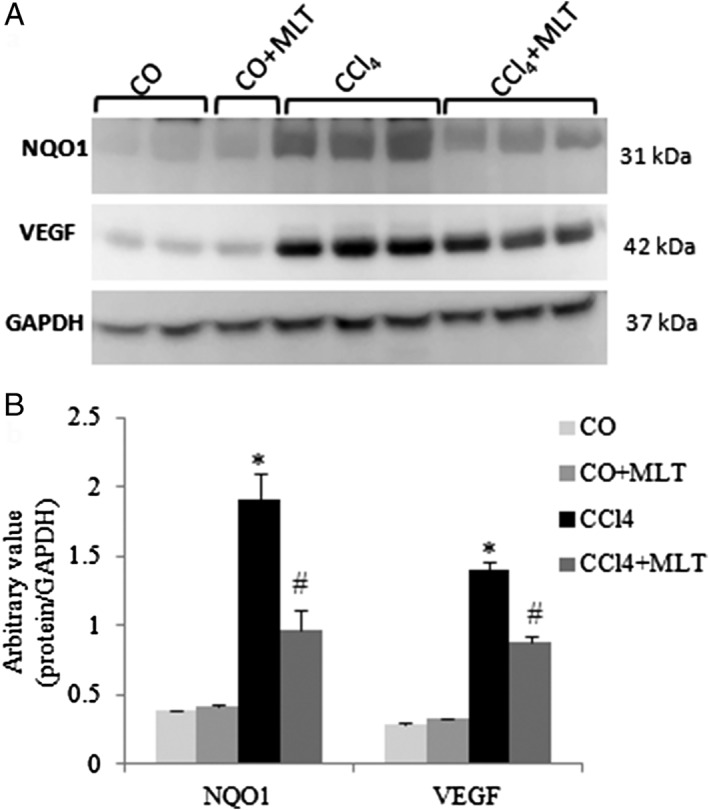
Figure 2.

Western blot analysis of NQO1 and vascular endothelial growth factor (VEGF). (a) Cytoplasmic fractions were analyzed by WB with NAD(P)H:quinone oxidoreductase 1 (NQO1) and VEGF and glyceraldehyde phosphate dehydrogenase (GAPDH) antibodies. (b) Arbitrary values expressed as mean and SD. *P < 0.05 carbon tetrachloride (CCl4) versus other groups. #
P < 0.05 CCl4 + melatonin (MLT) versus other groups.  CO,
CO,  CO + MLT,
  CCl4,
CCl4,  CCl4 + MLT.
