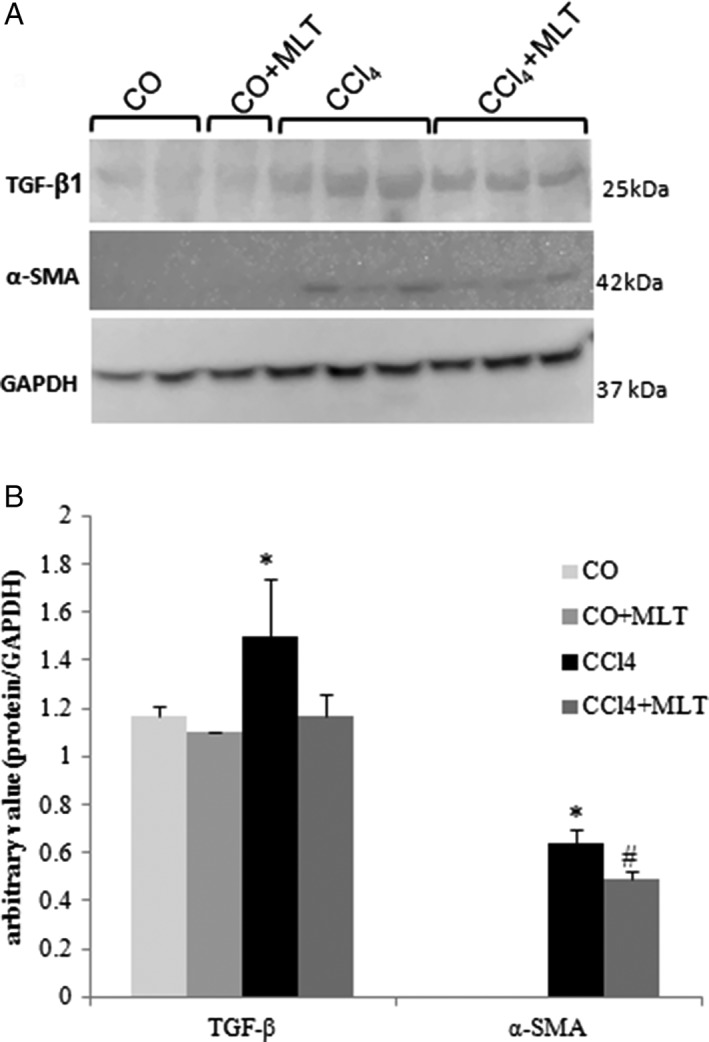
Figure 5.

Western blot analysis of transforming growth factor beta (TGF‐β) and alpha‐smooth muscle actin (α‐SMA). (a) Cytoplasmic fractions were analyzed by WB with TGF‐β and α‐SMA and glyceraldehyde phosphate dehydrogenase (GAPDH) antibodies. (b) Arbitrary values expressed as mean and SD. *P < 0.05 carbon tetrachloride (CCl4) versus other groups. #
P < 0.05 CCl4 + melatonin (MLT) versus other groups.  CO,
CO,  CO + MLT,
  CCl4,
CCl4,  CCl4 + MLT.
