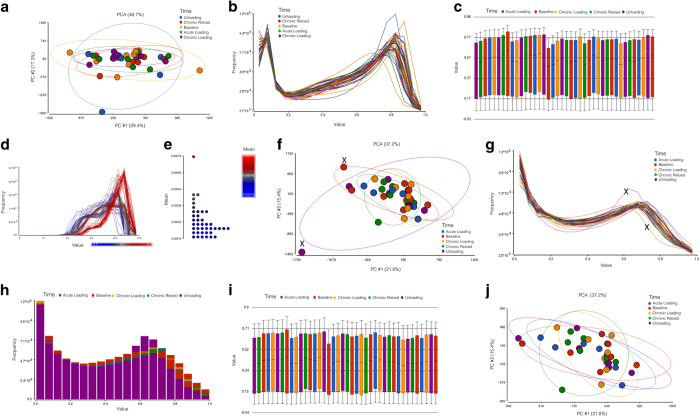
Figure 2. Complete quality control analysis completed on methylome-wide array.
(a). Principal component analysis of un-normalized samples where each sample is represented by a dot. Ellipsoids have been created as 2SD’s from the centroid for each time/condition. (b). Frequency plot by lines, with beta values are on the horizontal axis and their frequencies on the vertical axis (un-normalised samples). (c). Distribution of beta values across the samples and conditions by a box-and-whiskers plot (un-normalized samples) and conditions by a box-and-whiskers plot (un-normalized samples). (d). Density plot of the raw probe intensities/signals after normalization demonstrating all unmethylated and methylated signals were above 11.5. (e). Plot of detection P values (samples normalized) with an average of 0.0000257, well below 0.01 recommended. (f). Principal component analysis (PCA) (samples normalized) where each sample is represented by a dot. Ellipsoids have been created as 2SD’s from the centroid for each time/condition. PCA was derived and adapted from original analysis in our primary paper16. Licensed under the Creative Commons Attribution 4.0 International Public License. To view a copy of this license, visit https://creativecommons.org/licenses/by/4.0/legalcode. (g). Frequency plot by lines, with beta values are on the horizontal axis and their frequencies on the vertical axis, representing the distribution of intensity for each probe (samples normalised) Two samples were identified as 2SD’s from the centroid (in Fig. 2A above) and as showing differential distribution patterns and were removed from further down-stream analysis (annotated via ‘X’). Histogram derived and from original analysis in our primary paper16. Licensed under the Creative Commons Attribution 4.0 International Public License. To view a copy of this license, visit https://creativecommons.org/licenses/by/4.0/legalcode. (h). Frequency plot by bars, with beta values are on the horizontal axis and their frequencies on the vertical axis (samples normalized). (i). Distribution of beta values across the samples and conditions by a box-and-whispers plot (samples normalized). (j). PCA with ellipsoids 2SD’s from the centroid for time/condition, after removal of two samples that were 2SD’s from the centroid (in Fig. 2A above) and as showing differential distribution patterns (Fig. 2B above). Baseline = biopsy at rest, Acute Loading = Acute RE, Chronic Loading = Training, unloading = Detraining, Chronic Reload = Retraining.

