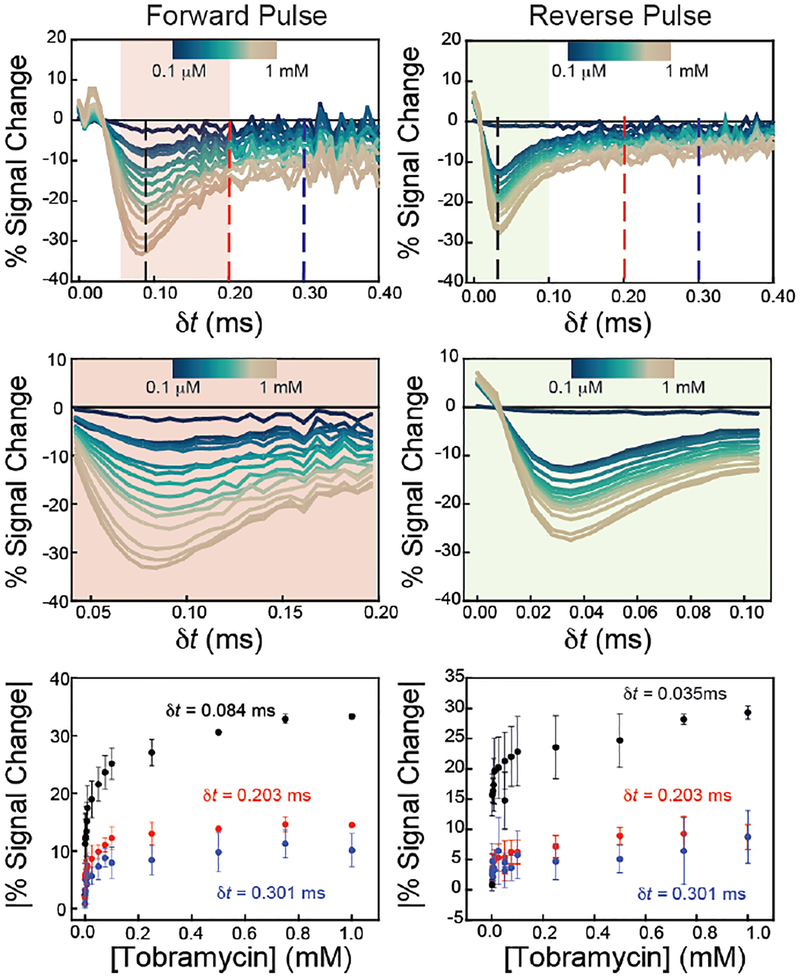
Figure 4.
Amperometric current response is quantitatively related to the concentration of tobramycin present, and the magnitude and polarity of that response is a function of when the current is measured after the application of a pulse (dt) for both forward (left) and reverse (right) pulses. (Top) Evaluation of current after a potential pulse shows a significant signal change in times as fast as 50 μs upon target addition, with the most significant changes occurring at 84 μs after the potential pulse. (Middle) Zoom-ins of the shaded regions show the sampling times that give greatest percent signal change. (Bottom) Plotting percent signal change at different dt values creates quantitative binding curves that can be fitted to Langmuir-like isotherms for quantitation of target concentrations. The current was sampled at three dt values, marked as dashed lines in the top plots.

