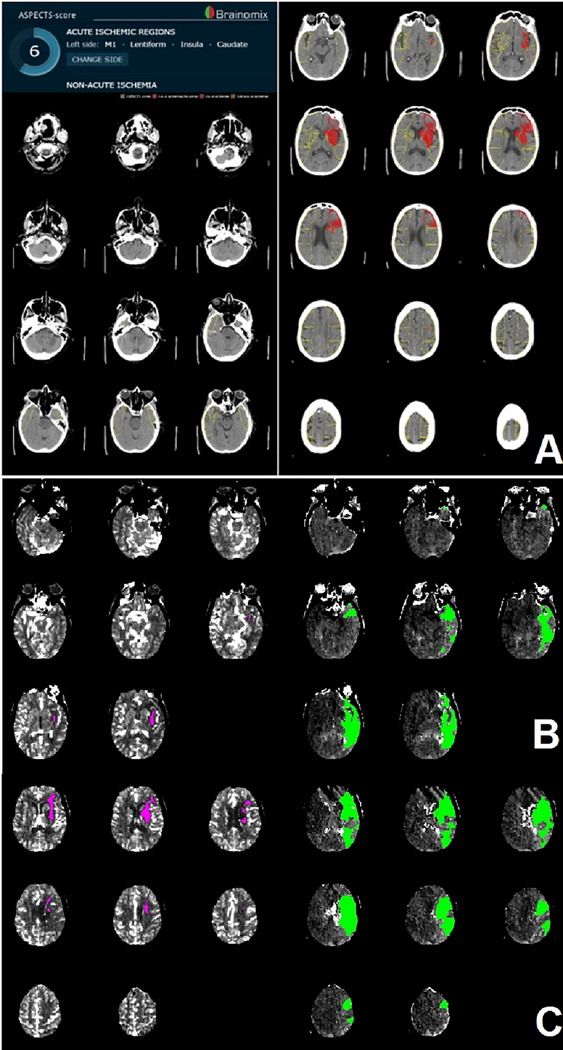
Figure 1. Example of automated CT imaging outputs.
Automated e-ASPECTS output (A). Regions with early ischemic changes are superimposed and marked red on the non-contrast CT of the brain. In this patient, the left caudate, lentiform nucleus, insula and M1 region show early ischemic changes. Resulting e-ASPECTS is 6. Automated RAPID CT perfusion output in 2 imaging slabs (B). Core (pink) and penumbra (green) volume are superimposed on the non-contrast CT. Estimated core volume is 6 ml. The penumbra volume is estimated at 116 ml.

