
Figure 2: Concordance Analysis.
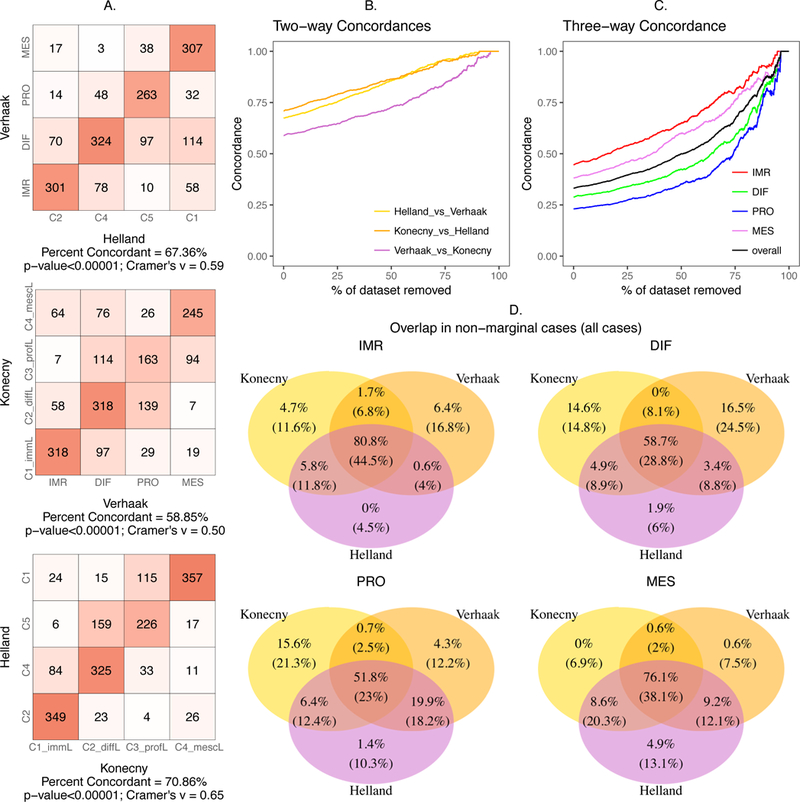
(A) Contingency table showing concordance of subtypes while comparing the methods pairwise (B) Pairwise concordance between the methods versus percentage of the dataset with samples of lower subtype margins removed, (C) three-way overall concordance between the methods and that of the individual subtypes versus percentage removed, (D) The classification of patients by three published algorithms as a Venn diagram for each of the four subtypes. Each area shows percentages of patients when all patients are classified (below, in parentheses) and after refusing to classify 75% of the most marginally classified tumors by any of the three methods (above). Thus, the numbers on the top of the three-way intersection are the concordant tumors according to the three original algorithms. Bottom numbers indicate relatively unambiguous subtype predictions by all three algorithms and which are also concordant with the others.