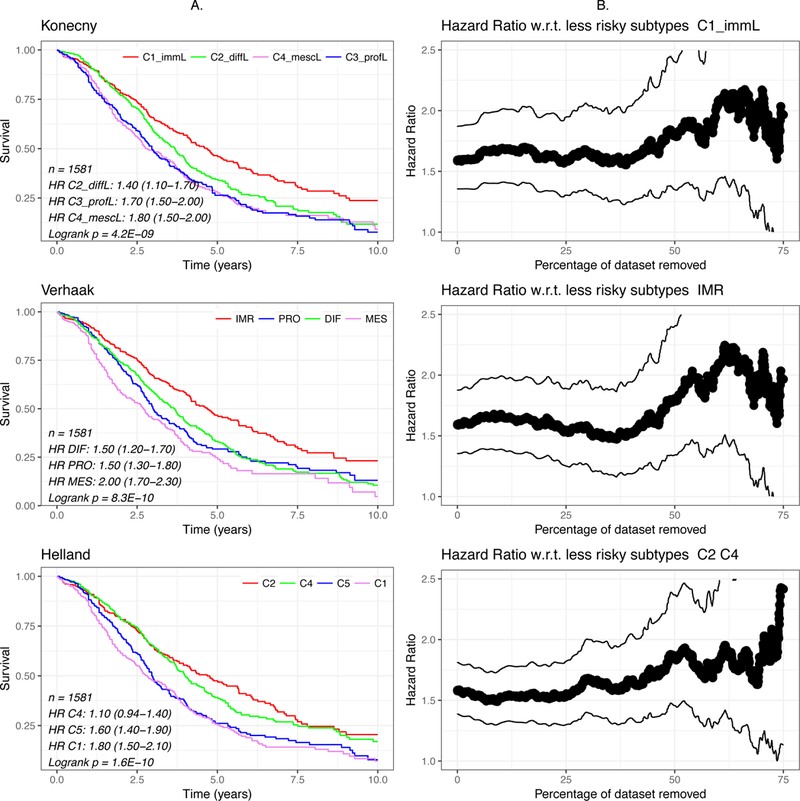
Figure 3: Survival Analysis.

(A) Kaplan-Meier curves of subtypes of the 1581 patients with survival data under different methods. (B) Hazard ratios and 95% confidence intervals of the lowest-risk subtype (Konecny and Verhaak) or two subtypes (Helland) compared to the remaining subtypes.
