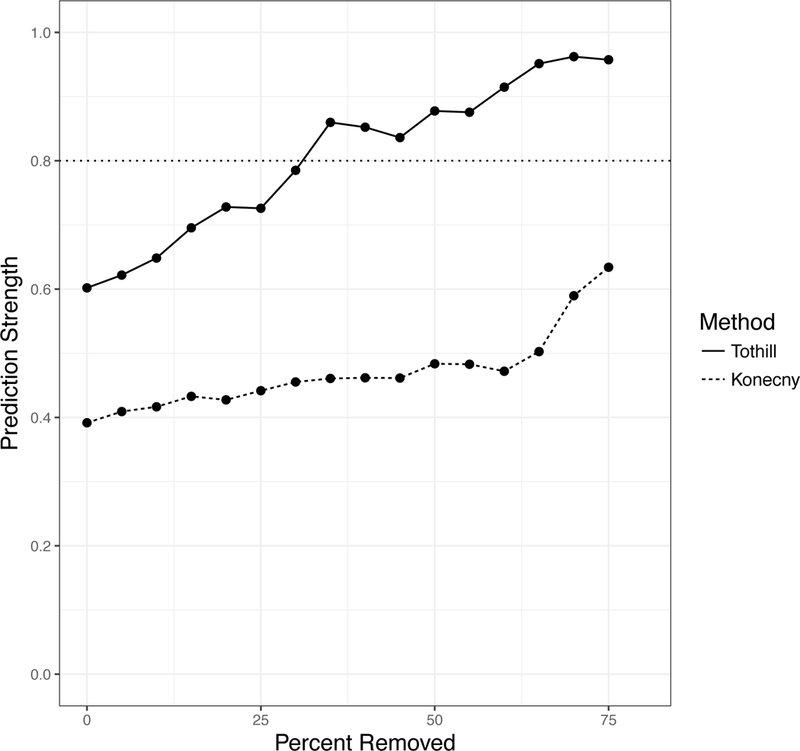
Figure 4: Robustness Analysis of published classifiers, by Prediction Strength.

In each dataset, concordance was calculated between the published classifier and a classifier re-trained on the validation dataset. The TCGA dataset also classified using the published classifiers of Helland and Konecny (no re-training was done for the classifiers). The TCGA dataset was also clustered using the methods of Tothill and Konency (in red and blue respectively). Samples were removed from Prediction Strength calculations starting with the most ambiguous samples (with the smallest difference between the top subtype prediction and runner-up subtype prediction); the x-axis shows the percent removed before computing prediction strength. Each algorithm improves in robustness when allowed to leave ambiguous samples, that it is less certain in its classification, unclassified.
