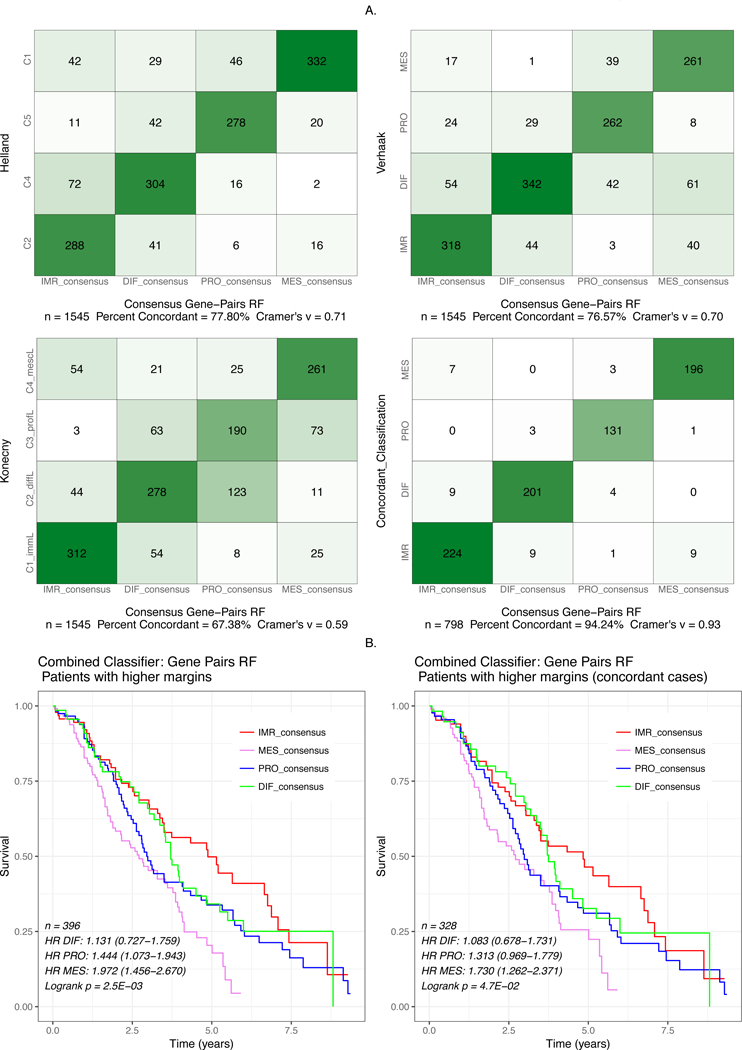
Figure 5: Concordance and Survival Stratification of consensusOV.

(A) Contingency plots showing concordance of subtype classification between consensusOV and the classifiers of Helland, Verhaak, Konecny. The fourth (bottom-right) plot shows the concordance between the consensus classifier and the patients concordantly classified between the three classifiers. (B) Survival curves for the pooled dataset provided by consensusOV. Classification was performed using leave-one-dataset-out validation. For the bottom two figures, classification with consensusOV was performed with the default cutoff, in which 75% of patients with the lowest margin are not classified.
