
Figure 6: Margin Analysis.
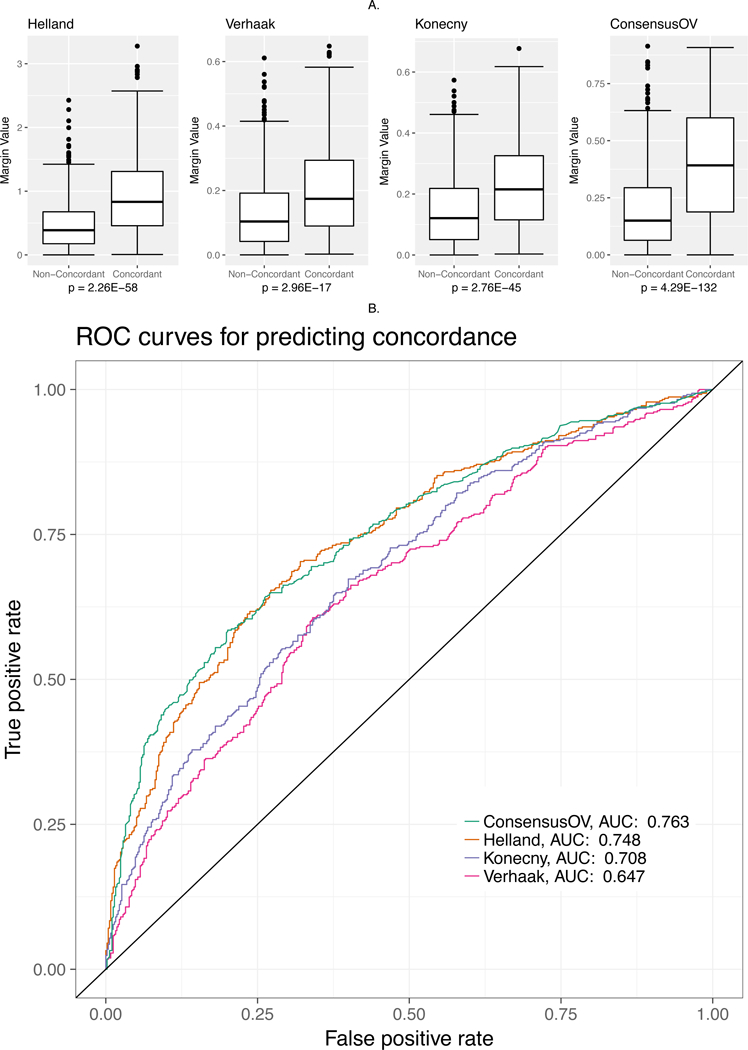
(A) Boxplots indicating the margin values assigned by each classifier to concordant and discordant cases. All statistical tests were performed using the Wilcoxon rank-sum test. (B) ROC curve for assessing the ability of margin values to discriminate between concordant and discordant cases.