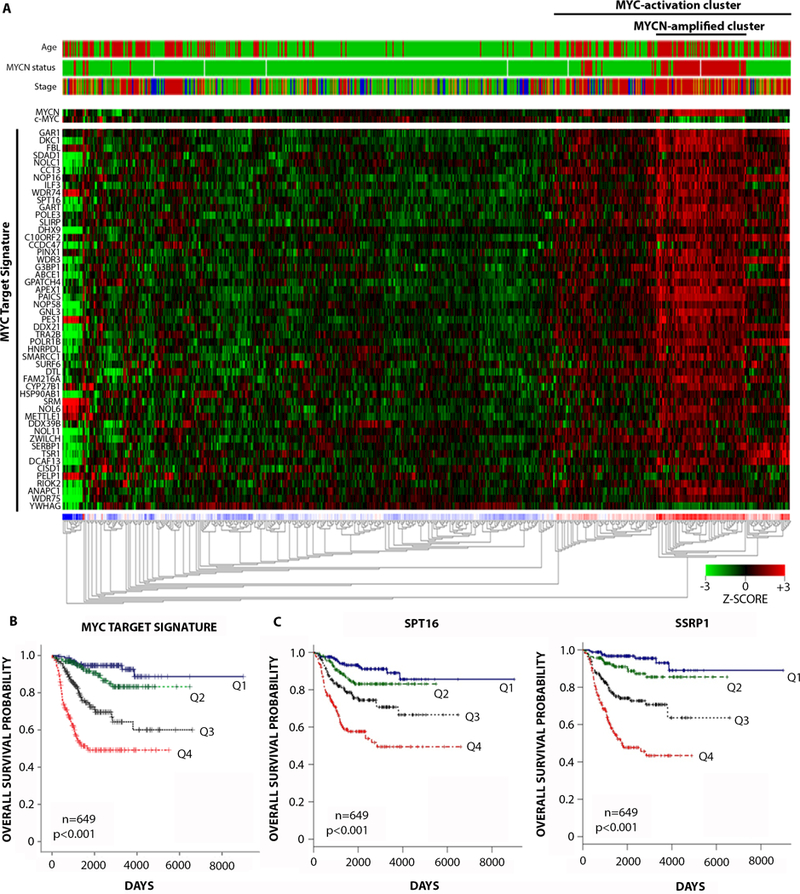
Fig. 1: FACT predicts poor prognosis in neuroblastoma patients and is associated with MYC signaling.

(A) Unsupervised hierarchical clustering on 649 neuroblastoma patients according to a 51-gene MYC target signature (7). Clinical parameters (top) were included as follows: patient age (>18 months: red, <18 months: green), MYCN amplification status (amplified: red, non-amplified: green), International Neuroblastoma Staging System (INSS) (Stage 1+2: green, Stage 3: orange, Stage 4: red, Stage 4S: blue). Clustering was performed according to Euclidean distance using the R2 Microarray Analysis and visualization platform (http://r2.amc.nl). (B) Kaplan Meier plots for overall survival of 649 neuroblastoma patients stratified by expression quartiles of the MYC target signature. MYC target signature expression quartiles were generated by averaging the expression of all 51 gene members of the MYC signature per patient and ranking lowest to highest: Q1, 0–25th patient percentile, Q2, 25th-50th patient percentile, Q3, 50th-75th patient percentile, Q4, 75th-100th patient’s percentile. P-value: pairwise log-rank tests on Q1 vs Q4, Q2 vs Q4, or Q3 vs Q4. See table S7 for individual p-values. (C) Kaplan Meier plots for overall survival of 649 neuroblastoma patients stratified by expression quartiles of SPT16 (left) and SSRP1 (right) as for (B) above.
