
Figure 1.
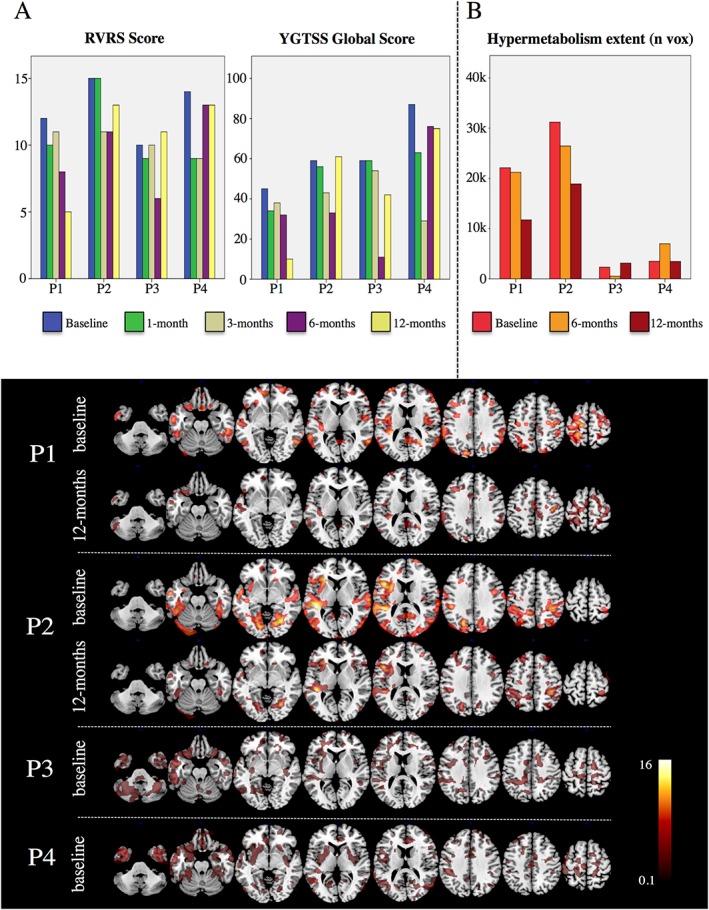
Longitudinal assessment of clinical and FDG‐PET brain metabolism in individual patients (listed from P1 to P4).
(A) Barplots show longitudinal variations of RVRS scores and YGTSS global scores at preset follow‐up times; (B) Barplot showing the longitudinal variations of hypermetabolic cluster extent (0‐40K number of voxels) at preset follow‐times, as measured at pFWE < 0.05 (minimum cluster extent 100 voxels); (C) Hypermetabolic patterns observed in patients at baseline and 12 months (only for patients 1 and 2, who showed the most significant changes at follow‐up. Patients 3‐4 showed limited regional metabolic increases and negligible FDG‐PET metabolism fluctuations a5 follow up (see Fig. 1B). SPM‐t maps (pFWE < 0.05) are overlaid on a standard anatomical T1 template with a multislice transaxial view.