Figure 2.

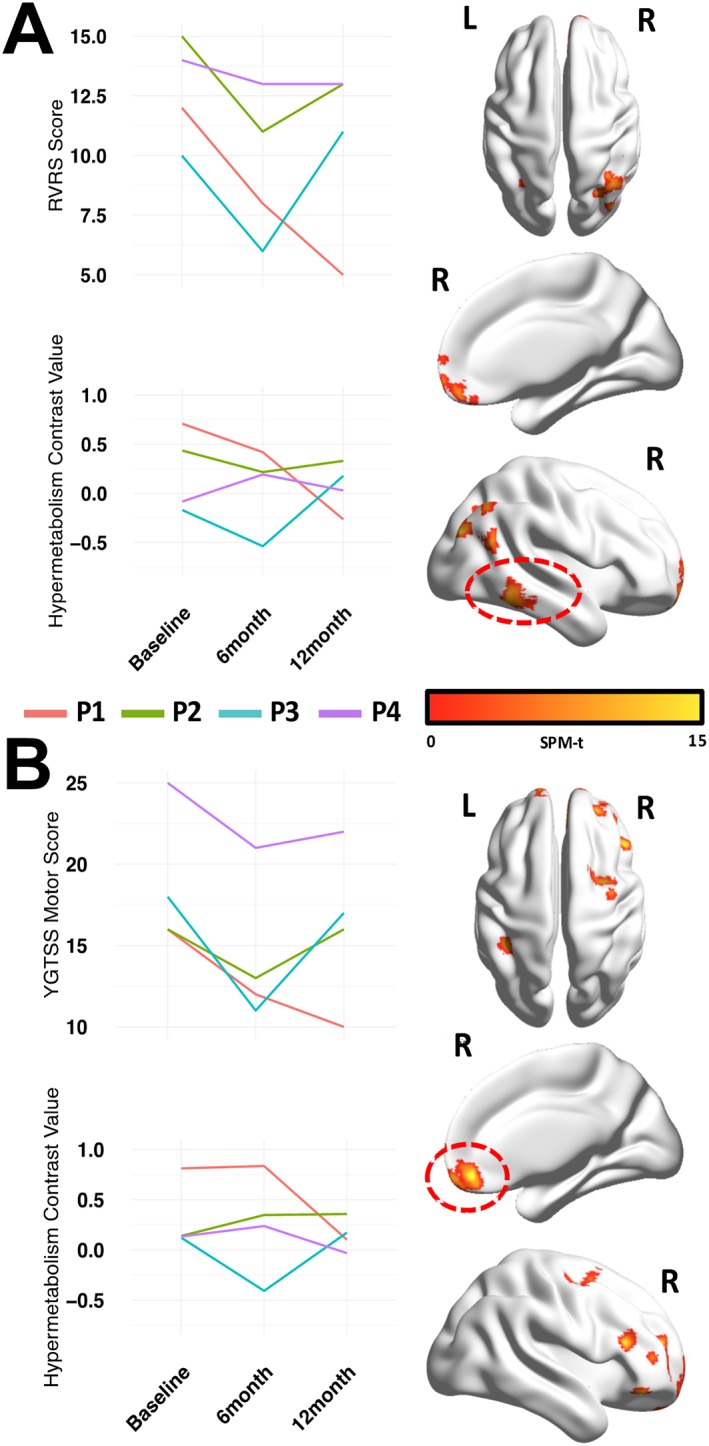
Clusters of significant association between changes in brain metabolism and changes in RVRS (panel A) and YGTSS Motor scores (panel B) at baseline, 6 and 12 months after implant.
Colored lines refer to individual patients (listed from P1 to P4). Figs on the right show thresholded (p < 0.001 uncorrected, k:100, p < 0.05 FWE cluster‐level) SPM‐t maps overimposed on an ICBM152 smoothed surface with BrainNet Software.34 Areas highlighted by the dashed red circle represent clusters with highest significance levels (lowest cluster‐corrected p‐value) in the model. Graphs on the left show comparisons between changes in brain glucose metabolism in the circled clusters and clinical scores measured at the different follow‐up time‐points.
