
Fig. 6. p38α phosphorylates and destabilizes p63.
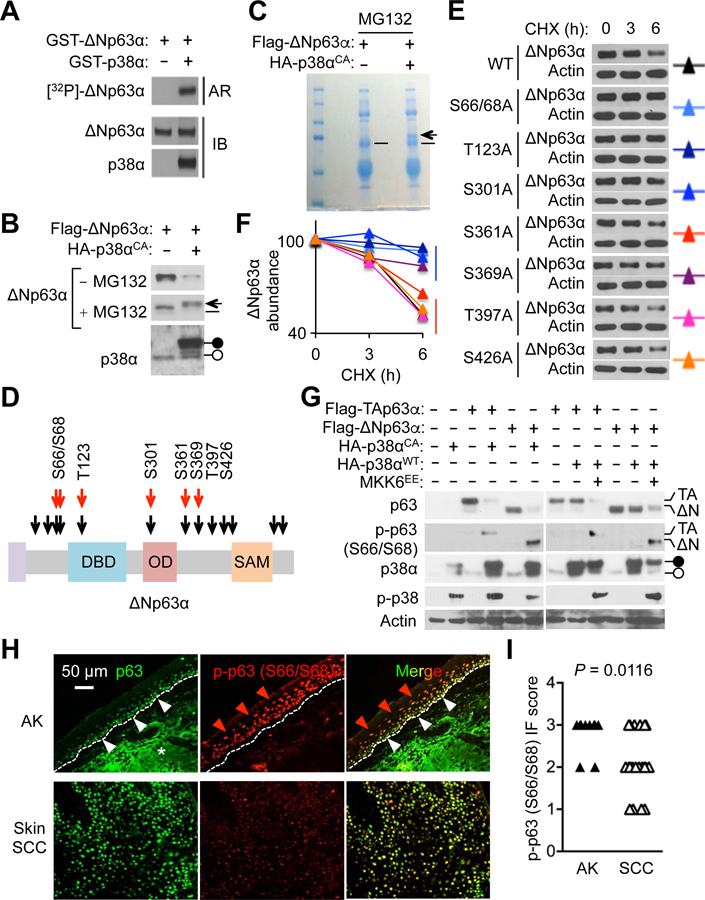
(A) 32P-radiolabel p63 from in vitro kinase reactions was analyzed by autoradiography and immunoblotting. Autoradiographic images and blots are representative of two experiments.
(B and C) 293T cells were transfected with plasmids expressing the indicated proteins. Whole cell lysates prepared 24 hours after transfection were analyzed by immunoblotting; where indicated, cells were incubated with MG132 (5 μM) for 12 hours before lysate preparation (B). p63 was immunoprecipitated from transfected/MG132-treated cell lysates and analyzed by SDS-PAGE and Coomassie Blue staining (C). Solid and open circles, plasmid-expressed and endogenous p38α, respectively (B); arrow and dash, putative phosphorylated and unphosphorylated p63, respectively (B and C). Blots and gel images are representative of two experiments.
(D) Phosphorylation sites on ΔNp63α are depicted. Black and red arrows, putative and experimentally determined p38α phosphorylation sites, respectively.
(E and F) KERT cells were infected with lentiviruses expressing the indicated p63 mutant derivatives. Whole cell lysates prepared 48 hours after lentiviral infection were analyzed by immunoblotting; cells were incubated with cycloheximide (CHX; 20 μg/ml) for the indicated durations before lysate preparation (E). p63 amounts were quantified by densitometry (F). Blots are representative of three experiments.
(G) 293T cells were transfected with plasmids expressing the indicated proteins. Whole cell lysates prepared 24 hours after transfection were analyzed by immunoblotting. Solid and open circles, plasmid-expressed and endogenous p38α, respectively; p-, phosphorylated. Blots are representative of three experiments.
(H and I) Human AK skin and skin SCC tumor sections (n = 10 and 20, respectively) were analyzed by immunostaining for the indicated molecules (H). Red and white arrowheads, epidermal cell layers with differential immunofluorescence (IF) signals; dotted line, the epidermal-dermal boundary; *, non-specific staining (H). p-p63 signals were graded from 0 to 3 based on IF intensity per cell (I). P values by Mann-Whitney test.