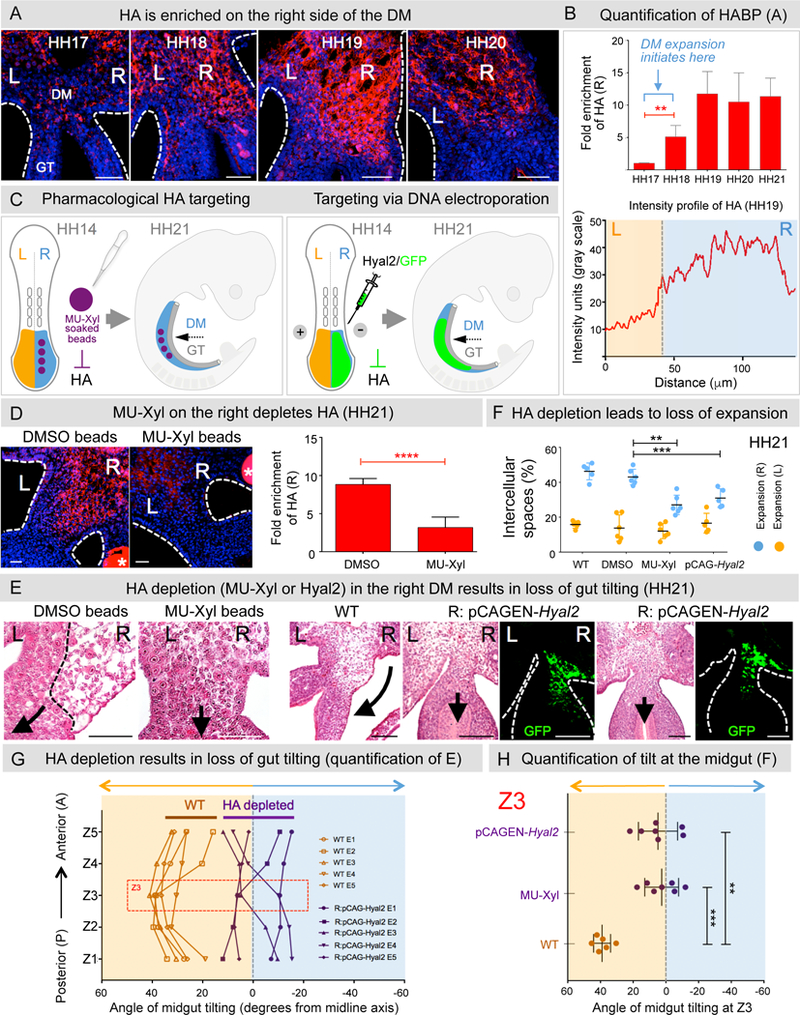
Figure 2: HA drives the right-sided mesenchymal expansion of the DM.

A HA staining using biotinylated HABP. B Quantification of HA accumulation: p = 0.007 between HH17–18, p = 0.025 between HH18–19, n = 6 embryos per stage. Average intensity profile of HA across the left (orange) and right (blue) axis at HH19. Fold enrichment calculated as area under intensity profile graph. C Left panel: MU-Xyl soaked beads (asterisks in D) are surgically inserted into the right coelomic cavity (HH14) prior to DM formation, Right panel: pCAGEN-Hyal2 DNA electroporation is utilized to degrade HA. D MU-Xyl treated DM shows significant reduction in HA accumulation (quantified in right panel, p = 0.0031, n = 7 embryos). E Depletion of HA in MU-Xyl treated embryos (panels 1–2) or pCAGEN-Hyal2 (panels 3–7) results in the loss of right-sided DM expansion. Quantification of E in F by measurements of intercellular spaces in the right panel: MU-Xyl vs DMSO: p = 0.0053, n = 6 embryos each for MU-Xyl, DMSO; WT vs pCAGEN-Hyal2, p = 0.0025, n = 5 embryos each for WT, pCAGEN-Hyal2). Tilting was quantified in G across the AP axis of the midgut (n = 5 embryos each for pCAGEN-Hyal2, WT) and in H in the Z3 region of the midgut: MU-Xyl vs WT, p = 0.00016, n =7 embryos each; pCAGEN-Hyal2 vs WT, p = 0.0025, n = 7 embryos each. Error bars represent mean ± SEM. See also Figure S3A. Scale bars: A (50 µm); D (30 µm); E (50 µm for panels 1–2 and 100 µm for panels 3–7).
