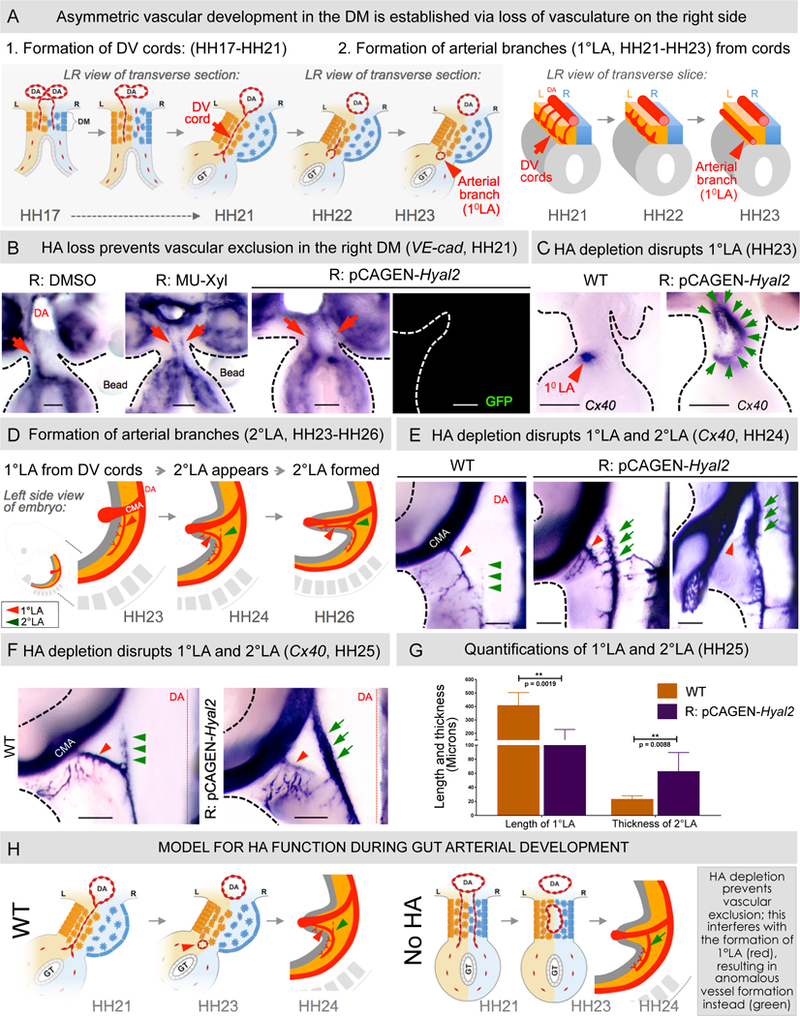
Figure 3: Loss of HA from the right DM perturbs gut arterial vasculature.

A WT asymmetric DM arteriogenesis. B VE-cadherin RNA ISH (HH21) shows ectopic maintenance of DV cords upon HA depletion (p = 0.0152 for DMSO vs MU-Xyl, n = 0/10 for DMSO, n = 6/12 for MU-Xyl, p = 0.0028 for WT vs pCAGEN- Hyal2, n = 0/12 for WT, n = 10/15 for pCAGEN-Hyal2 embryos). C Cx40 RNA ISH of HH23 embryo slices showing normal 1°LA in WT embryos (red arrowhead) and significantl y enlarged 2°LA-like vessel upon Hyal2 targeting (green arrows, p = 0.0325 for WT vs pCAGEN-Hyal2, n = 0/10 WT embryos, n = 5/10 pCAGEN-Hyal2 embryos). D Schematic of formation of arterial branches in WT embryos. (EF) Hyal2 targeted embryos (Cx40, HH24-HH25) lack (red arrowhead) or have significantly truncated 1°LA and show premature formation of anom alous 2°LA-like vessel, quantified in G: loss/truncation of 1°LA, p = 0.0019 for WT vs pCAGE N-Hyal2, n = 0/5 embryos WT, n = 7/7 pCAGEN-Hyal2; abnormal thickness, p = 0.0088 for WT vs pCAGEN-Hyal2, n = 0/5 embryos WT, n = 6/7 embryos pCAGEN-Hyal2). Error bars represent mean ± SEM. H Model for HA function during DM arterial patterning. CMV, cranial mesenteric artery; DA, dorsal aorta; DV cords, dorso-ventral cords. See also Figures S2 and S3A. Scale bars: B, C (100 µm); E, F (200 µm).
