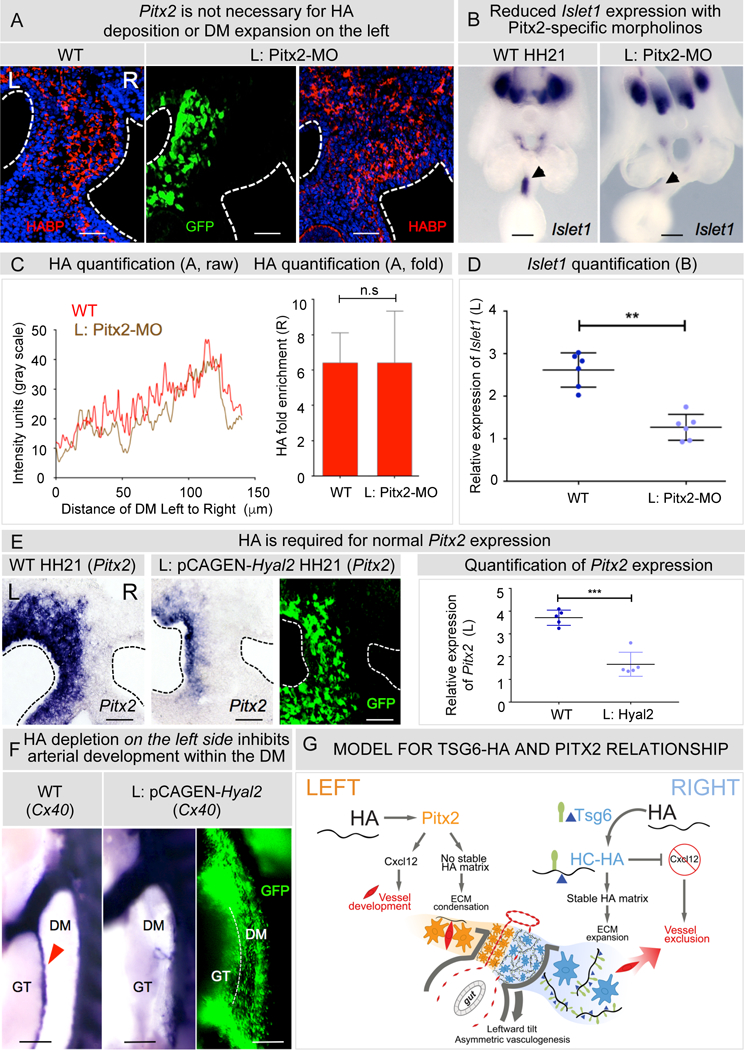
Figure 8: HA-Tsg6 pathway is independent of Pitx2 activity on the left.

A Knockdown of Pitx2 in left DM with Pitx-MO does not affect HA deposition (quantified in C using average intensity profiles of HA distribution and fold enrichment of HA, p = 0.1558 for WT vs Pitx2-MO, n = 5/5 WT, n = 11/11 Pitx2-MO). B Validation of Pitx2-MO showing reduction of Islet1 expression (quantified in D using imageJ and integrated density ratios of Islet1 expression p = 0.0029 for WT vs Pitx2-MO, n = 0/6 WT, n = 6/6 Pitx2-MO,). E Degradation of HA on the left by pCAGEN-Hyal2 electroporation reduces normal Pitx2 expression, quantified as integrated density ratios (p = 0.0084 for WT vs pCAGEN-Hyal2, n = 0/5 WT, n = 5/5 pCAGEN-Hyal2). F pCAGEN-Hyal2 inhibits arteriogenesis in left DM (p = 0.0001 for WT vs pCAGEN-Hyal2, n = 0/16 WT, n = 8/10 pCAGEN-Hyal2) G Model for the Tsg6-HA (right) and Pitx2 (left) pathway in the DM: HA production and Tsg6 catalysis on the right makes stable HC-HA and initiates rotation. The HC-HA matrix negatively regulates Cxcl12 in right DM leading to vascular exclusion and left-side restricted arteriogenesis. On the left, Pitx2 regulates Cxcl12-dependent vascular remodeling. Nascent HA deposition on the left is required to maintain Pitx2. Error bars represent mean ± SEM. Scale bars A, E (50 µm); B (200µm); F (100 µm). See also Figure S5, S6.
