
Figure 3. Variability in Predicted Risk of Poor Outcome Across Sites in TVT.
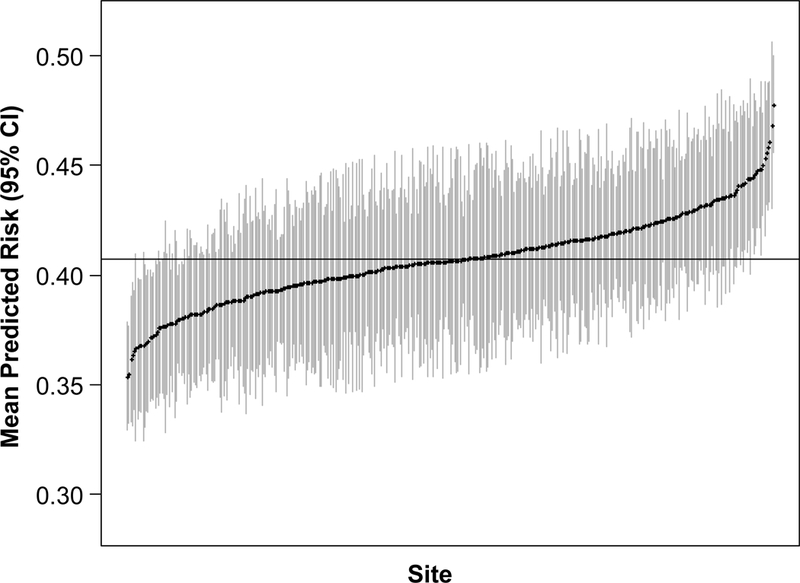
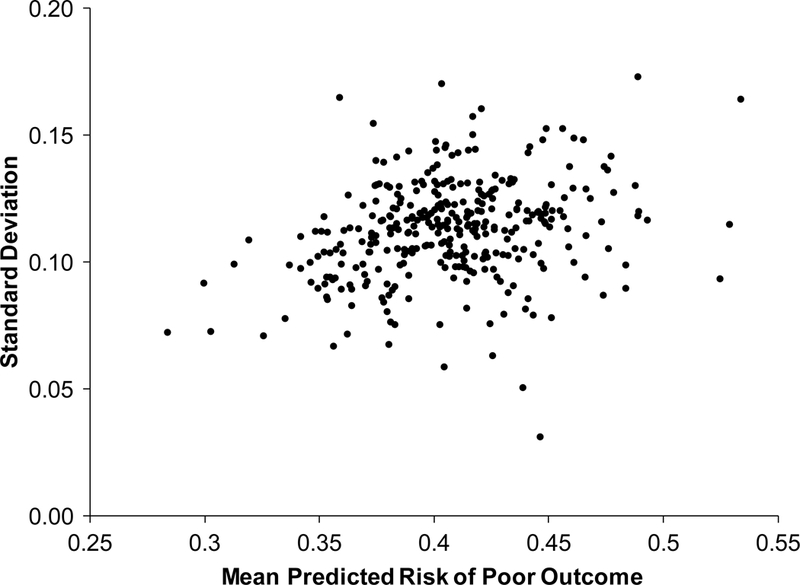
(A) Mean predicted risk of poor outcome (with 95% confidence interval) of patients treated with TAVR at each site from July 1, 2014-June 30, 2016. (B) Site-level mean versus standard deviation predicted risk of poor outcome