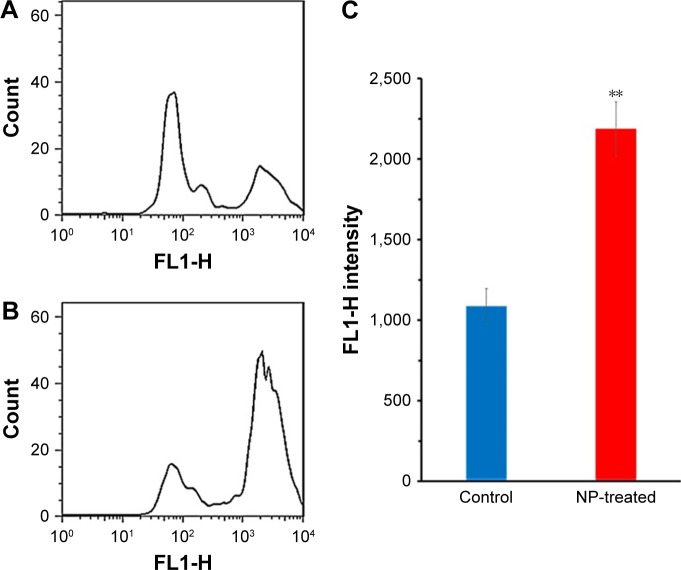
Figure 8.
Mean ROS formation in the lymphocyte cell in the absence (A) and presence of IC50 concentration of NGOs (B). The quantitative analysis was plotted to show the ROS result based on the FL1-H intensity (C).
Note: **P<0.01 compared with the negative control sample.
Abbreviations: NGO, nano graphene oxide; NP, nanoparticle.

