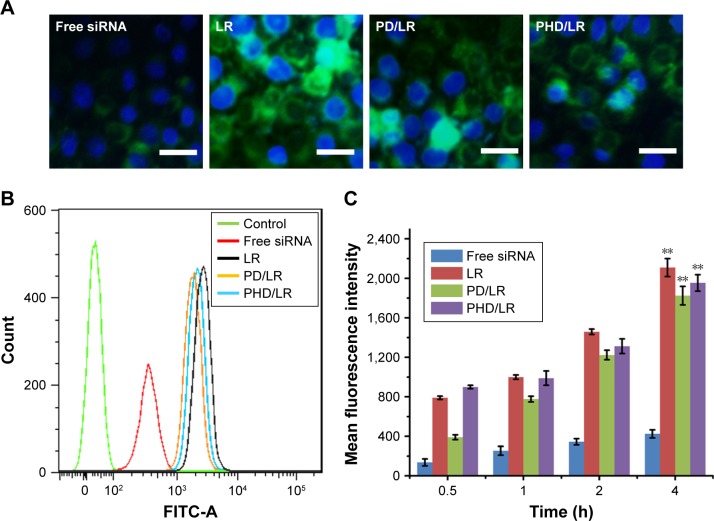
Figure 4.
Cellular uptake assay of different formulations. (A) Cellular uptake of different formulations analyzed using fluorescence microscopy. Green and blue represented siRNA and nucleic, respectively. Scale bar represented 50 µm; flow cytometry measurement of cellular uptake of different formulations at 4 hours (B) and time-dependent cellular uptake (C).
Note: **P<0.01.
Abbreviations: LR, lipoplex; mPEG, methoxy poly(ethylene glycol); PD, PHis-PSD; PHD, mPEG-PHis-PSD; PHis, poly(histidine); PSD, poly(sulfadimethoxine).

