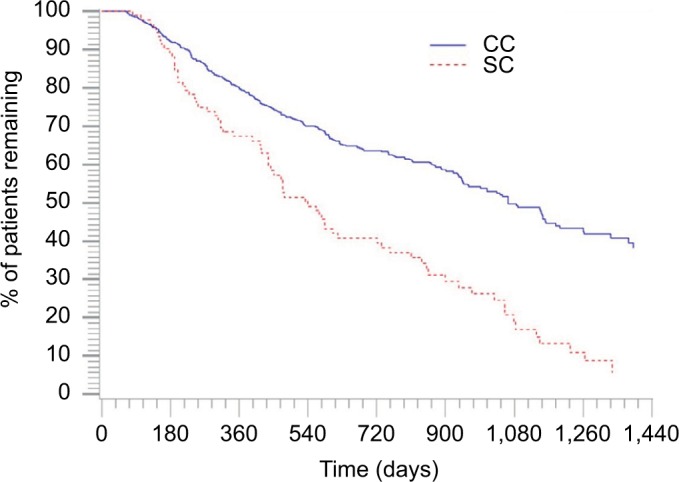
Figure 3.

Kaplan–Meier curve for any infused anti-TNF-α use for the matched cohorts during the study period.
Note: P-value is <0.001.

Kaplan–Meier curve for any infused anti-TNF-α use for the matched cohorts during the study period.
Note: P-value is <0.001.