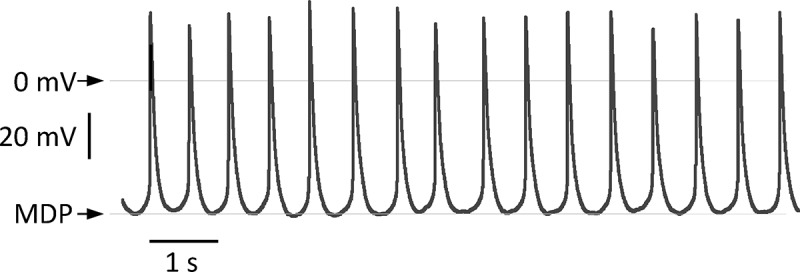
Figure 1.

The figure shows a recording of spontaneous action potentials in a single isolated SAN myocyte recorded in current clamp in the whole cell configuration of the patch clamp. It illustrates the characteristic morphology of the action potential. The line indicates 0 millivolt and the maximum diastolic potential was −50 mV.
