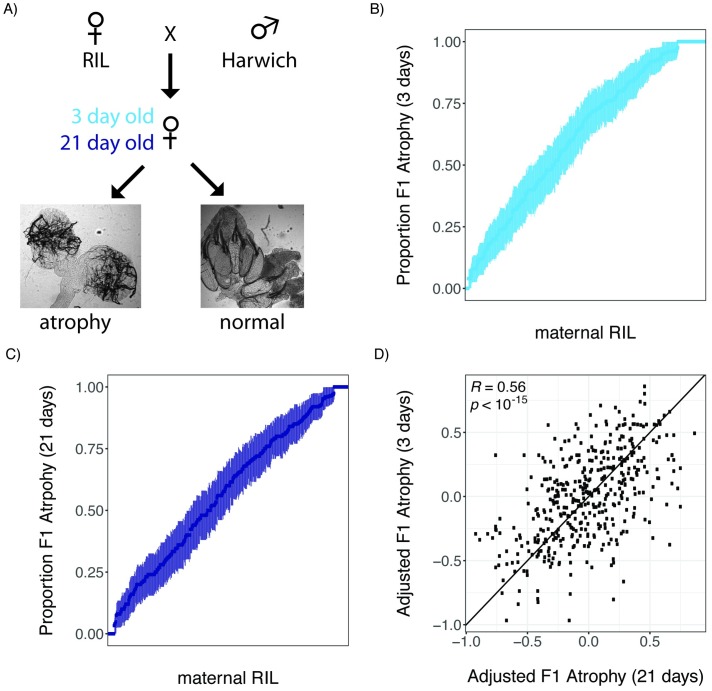
Fig 1. Heritable phenotypic variation in tolerance of P-element activity in the female germline.
(A) Crossing scheme for documenting variation in tolerance of P-element activity among RIL offspring, including representative images of atrophied and normal ovaries. (B and C) Phenotypic variation in the proportion of 3-day-old (B) and 21-day-old (C) F1 female offspring of different RILs. RILs are sorted according to the proportion of F1 atrophy observed in their offspring, and error bars indicate the standard error of the estimated proportion. (D) Scatterplot of the arsine-transformed proportion of F1 atrophy observed among 3-day-old and 21-day-old offspring of the same line, after accounting for the effects of experimenter and experimental block. The individual numerical values for panels B, C, and D can be found in S1, S2 and S3 Data, respectively. F1, filial 1; RIL, recombinant inbred line.

