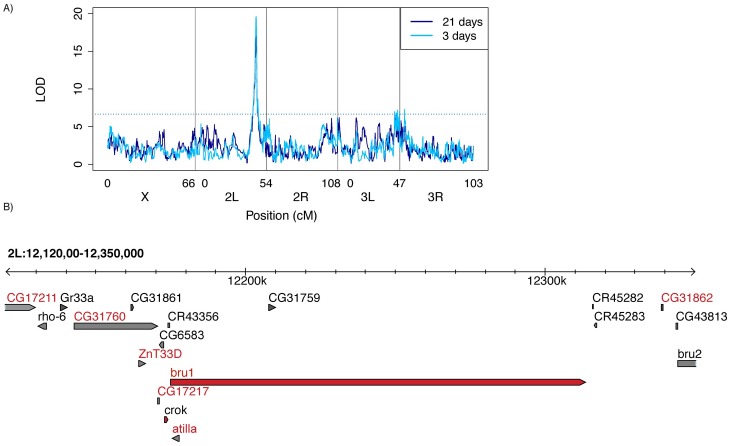
Fig 2. QTL mapping of variation in P-element tolerance.
(A) LOD ratio of the observed association between maternal RIL genotype [29] and the adjusted proportion of F1 atrophy phenotype. Higher LOD scores correspond to stronger evidence of linkage, and significant LOD scores are above the threshold (dotted line), which was obtained from 1,000 permutations of the observed data. (B) Two LOD drop confidence interval of the QTL peak based on a combined QTL analysis including both 3-day-old and 21-day-old F1 females. Genes indicated by red letters are potentially affected by polymorphisms in the RIL founders that are in phase with the inferred allelic classes (Fig 3 [46]). Gene models indicated in red are highly expressed in the Drosophila melanogaster ovary [47]. The individual numerical values required to generate LOD plots for 3-day-old and 21-day-old F1 females can be found in S4 and S5 Data, respectively. bru1, bruno; bru2, bruno-2; cM, centimorgan; crok, crooked; F1, filial 1; LOD, logarithm of the odds; P-element; QTL, quantitative trait locus; rho-6, rhomboid 6; RIL, recombinant inbred line.

