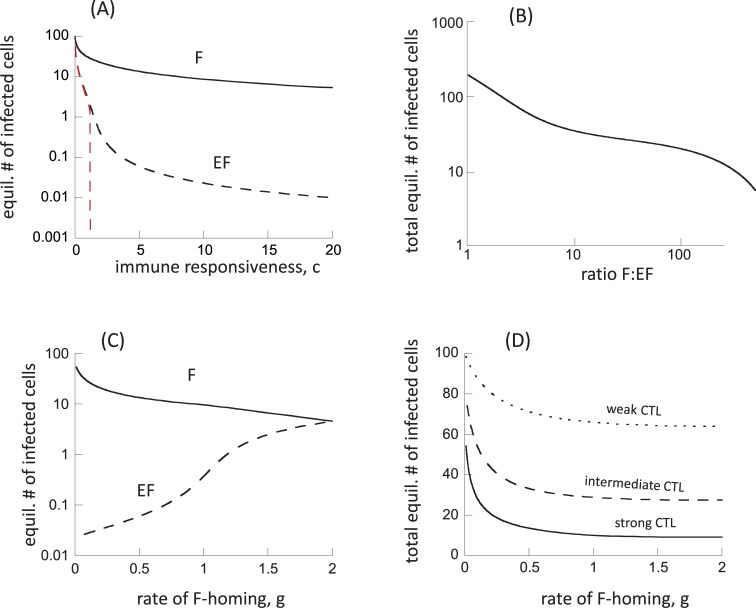
Fig 3. Properties of model (2), assuming the presence of antigen-induced stimulation in the follicular compartment.
(A) Equilibrium number of virus-producing cells in the two compartments as a function of the rate of CTL expansion. Since CTL are assumed to expand in both compartments in this model, we varied the expansion rate in both, by setting c = ce = cf. The red dashed lined depicts results under the assumption that virus-producing cells cannot migrate between the two comparmtents, η = 0. (B) Relationship between the equilibrium number of virus-producing cells and the ratio of follicular to extrafollicular virus load (F:EF). (C) Equilibrium number of virus-producing cells in the two compartments as a function of the rate at which CTL home to the follicular compartment, g. We note that the graph does not start at g = 0, but at g = 0.01. (D) Total equilibrium number of virus-producing cells (summed over both compartments) as a function of the rate at which CTL home to the follicular compartment, g. Base parameters were chosen as follows. λe = λf = 50, d = 0.01, βe = , βf = 0.00072, a = 0.45, η = 0.01, ce = cf = 5, b = 0.01, p = 0.001, g = 0.5, h = 2. For (D), we assumed ce = 5 for the strong CTL response, ce = 1 for the intermediate response, and ce = 0.2 for the weak response.

