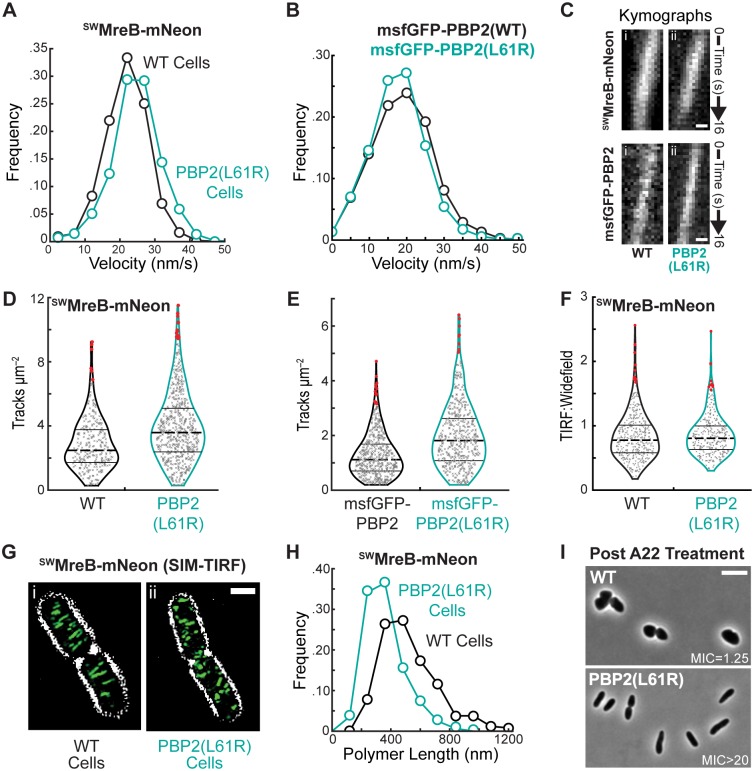
Fig 6. Rod system dynamics in PBP2(L61R) cells.
A. Histograms of velocity measurements determined for individual traces of SWMreB-mNeon (attλHC897) in wild-type (22±6 nm/s, n = 1467; black) and PBP2(L61R) cells [PR78] (25±7 nm/s, n = 949; turquoise). B. Histograms of velocity measurements determined for individual tracks of msfGFP-PBP2 (attλHC943) (18.9±8.1 nm/s, n = 2692; black) and msfGFP-PBP2(L61R) (attλPR128) (17.8±7.5 nm/s, n = 3440; turquoise) in ΔpbpA cells. Bin size, 5 nm/s. C. Kymographs of individual SWMreB-mNeon (attλHC897) tracks in wild-type (i) and PBP2(L61R) (ii) cells are displayed atop kymographs of individual msfGFP-PBP2 (attλHC943, i) or msfGFP-PBP2(L61R) (attλPR128, ii) tracks in ΔpbpA cells. Scale bar, 250nm. D. Violin plots for the number of SWMreB-mNeon tracks measured per cell area (um2) in wild-type (2.8±1.58, n = 609; black) and PBP2(L61R) cells (3.85±2.14, n = 300; turquoise) at 37°C. p<1e-10, Mann-Whitney U. The distribution of values along the x-axis capture the frequency of measurements along the y-axis. Lines designate quartiles with the dotted line indicating the mean value. Outliers are highlighted in red. E. Violin plots for the number of msfGFP-PBP2 (1.16±0.84, n = 581; black) and msfGFP-PBP2 (1.92±1.19, n = 517; turquoise) tracks measured per cell area (um2) in ΔpbpA cells at 30°C. As expected [36] there are less directionally moving rod complexes at lower temperatures. p<1e-29, Mann-Whitney U. F. Violin plots illustrating the distribution of normalized fluorescence measurements for SWMreB-mNeon (attλHC897) expressed in wild-type (0.83±0.36, n = 397) and PBP2(L61R) cells (0.85±0.31, n = 321). The fluorescence intensity acquired under TIRF illumination for individual cells was integrated and divided by similar measurements taken under widefield illumination, providing an approximation for the relative abundance of surface-associated SWMreB-mNeon. G. Representative SIM-TIRF micrographs of SWMreB-mNeon integrated at the native locus in wild-type [JAB593] and PBP2(L61R) cells [JAB576]. The signal for SWMreB-mNeon is pseudocolored green and overlaid a contrast-adjusted phase-contrast image. Scale bar, 1μm. H. Distributions of SWMreB-mNeon polymer lengths in wild-type [JAB593] (520±190nm, n = 502; black) and PBP2(L62R) cells [JAB576] (360±130nm, n = 614; turquoise). Bin size, 120nm. p<1e-53, Mann-Whitney U. I. Representative phase-contrast micrographs of wild-type [MG1655] or PBP2(L61R) [PR78] cells after a 4hr treatment with 2 μg/mL A22, an MreB-inhibitor. The minimum inhibitory concentration (MIC) of A22 for each cell type is displayed in μg/mL.

