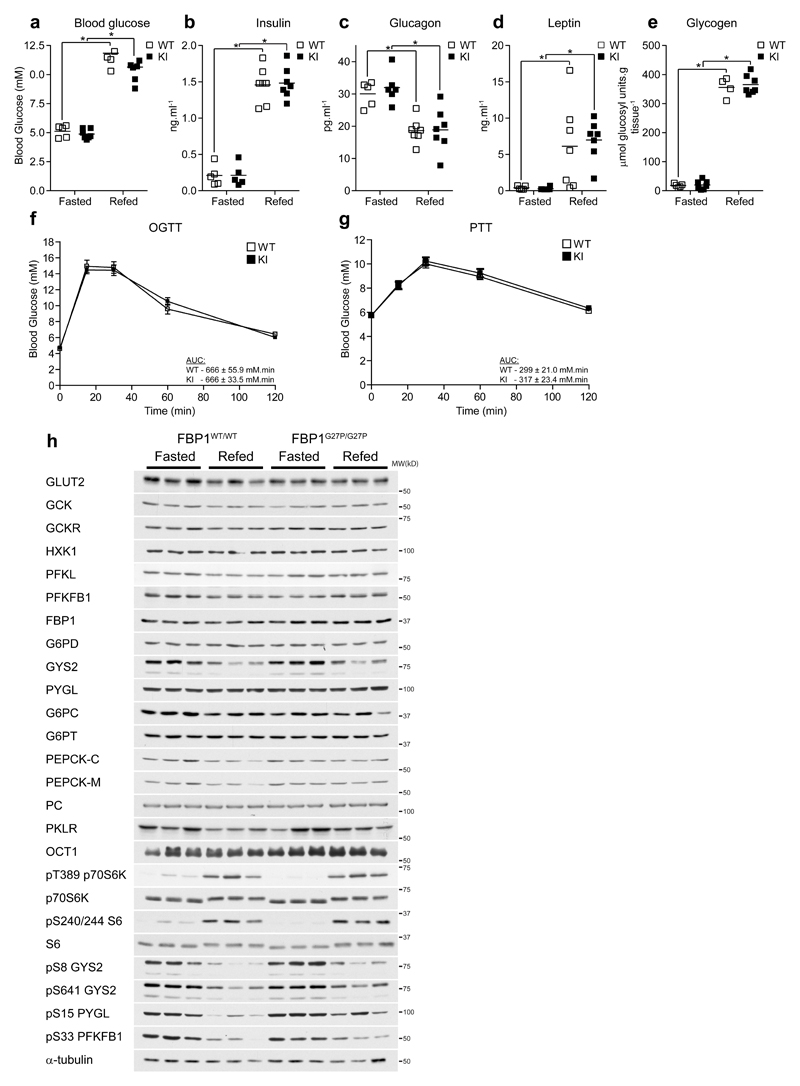
Figure 2. FBP1 G27P knockin mice display normal glucose homeostasis.
(a-e) FBP1WT/WT (WT) or FBP1G27P/G27P (KI) mice were fasted overnight for 16 h (Fasted) or subsequently given free access to standard chow for 4 h (Refed). Blood and liver biopsies were taken and the following parameters determined: blood glucose (a), plasma insulin (b), plasma glucagon (c), plasma leptin (d) and liver glycogen (e). n = 5-7 (WT) and 5-7 (KI) per group. (f) Glucose (2 g.kg-1 p.o.) and (g) pyruvate (1 g.kg-1 i.p.) tolerance was assessed on mice fasted for 16 h. Results represent mean ± SE, n = 10 per group. (h) Expression of the major enzymes and regulatory components of the gluconeogenic, glycogenic and glycogenolytic pathways in liver samples from fasted or refed animals was determined by Western blotting. Representative results from three mice per group are shown. *P < 0.05 (Fasted vs. refed). Statistical significance was determined using unpaired, two-tailed Student’s t-test and an alpha level of 0.05.

