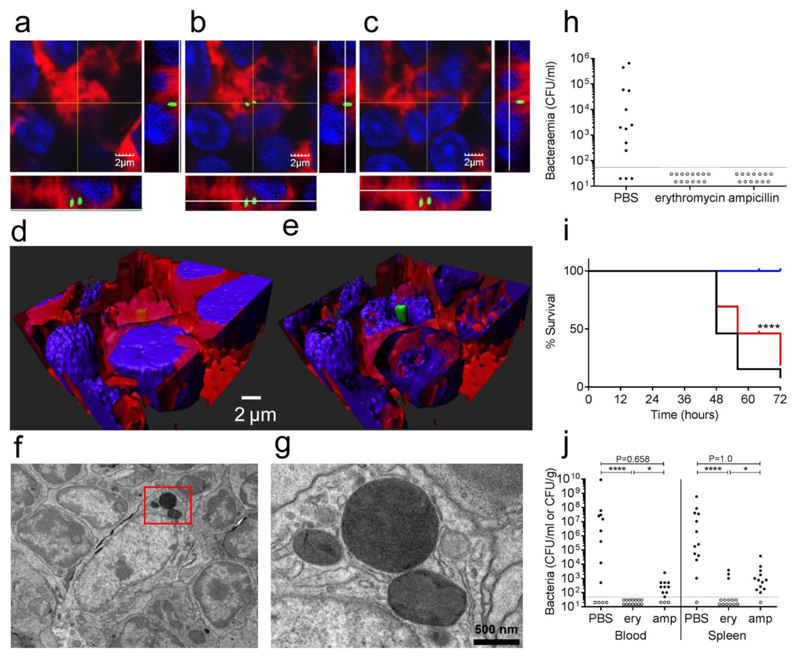
Figure 4. The intracellular phase of S. pneumoniae in the early stages before overt septicaemia.
Panel a-c show three orthogonal views of intracellular pneumococci (green gfp), in this representative (5 sections from 3 different samples) multi-stack acquisition the green GFP-tagged bacteria are localised within the cytoplasm of the host cells 4 hours after the infection (60X magnification). The plasma membrane is shown in red (WGA 633 conjugated) and nuclei are stained in blue (DAPI). Three-dimensional reconstruction through deconvolution analysis clarifies the localisation of the pneumococci within the host cell (d-e). Further analysis with transmission electron microscopy identified groups of pneumococci in the cytoplasm of splenic macrophages. A representative image at 6000X magnification is shown in panel f (3 spleens analysed), while panel g is showing an enlarged insert of the same image (20000X magnification). The importance of the pneumococcal intracellular phase was assessed by treating CD1 mice after the infection (dose of 1 x 10⁶ CFU of strain D39) with antibiotics that have different penetration rates into the host cells (h-j). Two doses of both erythromycin (high penetration rate) and ampicillin (low penetration rate) were administered intraperitoneally at 1 and 5 h post-infection to groups of mice (12-13 animal per group). The doses were chosen so that the predicted drug half-life would reduce the drug plasma levels in 11 h to the minimal inhibitory concentration (MIC). Blood counts at 24 h after infection (panel h) show antibiotics to be equally effective in preventing bacteraemia in comparison to control (p<0.001). The limit of detection is shown as a dotted line. Analysis of later time points indicate that survival is greater significantly higher in the erythromycin group (blue) both with respect to the ampicillin group (red) and control (panel i). **** P<0.0001 kaplan-meier two-tailed test. Survival correlates to the terminal bacterial blood and spleen counts which are lower in erythromycin (ery) treated mice with respect to control in blood and to both control and ampicillin (amp) in the spleen (panel j). (**** P<0.0001, * P<0.05, Fisher’s exact test, one tailed)

