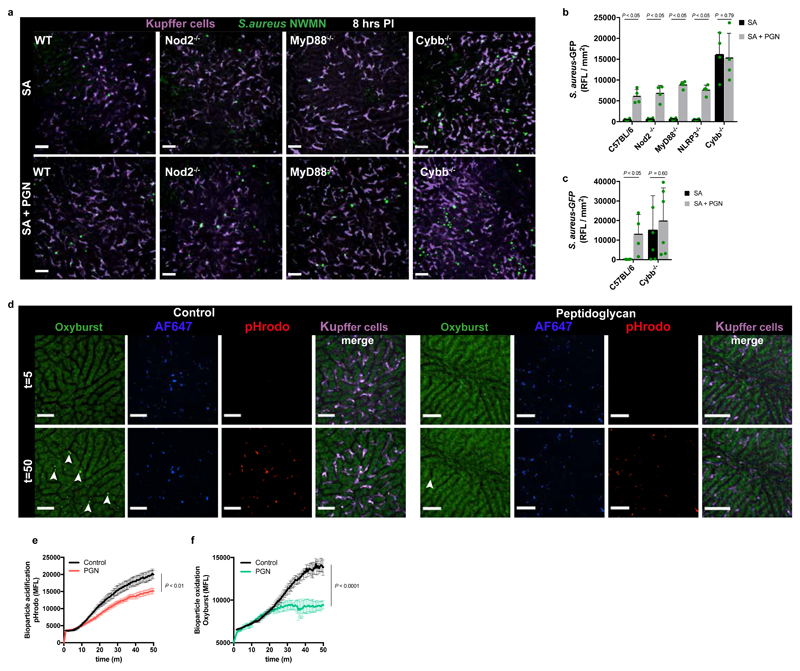
Figure 4. Reduced oxidative burst in KCs permits augmentation of S. aureus virulence.
a,b, Representative SD-IVM image of mouse livers (a) or quantification of 2 mm2 stitched SD-IVM images for GFP-fluorescence, scale bar 50 μm (b) at 8 h after i.v. infection with S. aureus BSG1 (SA, 107 CFU) with and without co-injection of 500 μg PGN in male C57BL/6J, Nod2-/-, MyD88-/-, NLRP3-/- or Cybb-/- mice, n = 4 per group; mean shown, error bar s.d., unpaired t-test two-tailed. c, Quantification of 2 mm2 stitched SD-IVM images for GFP-fluorescence at 24 h after i.v. infection with S. aureus BSG1 (SA, 105 CFU) with and without co-injection of 500 μg PGN in male C57BL/6J or Cybb-/- mice, n = 4 per group, mean shown, error bar s.d., unpaired t-test two-tailed. d, SD-IVM image of mouse livers injected with pH-rodo S. aureus bioparticles (red) additionally labelled with AF647 (blue) as a reference fluorophore and OxyBURST (green) with and without (control) co-injection of 500 μg PGN at 5 and 50 min post infection, scale bar 50 μm. Arrows point to oxidized bioparticles. n = 3 per group. e,f, Quantification of intracellular acidification of pH-rodo (e) or oxidation of OxyBURST labelled S. aureus bioparticles (f) in KC over time in C57BL/6J mice with and without (control) co-injection of 500 μg PGN. Data represent the mean fluorescence of S. aureus bioparticles compiled from five separate FOV per time point, n = 3 per group, error bars, s.e.m, two-way ANOVA.

