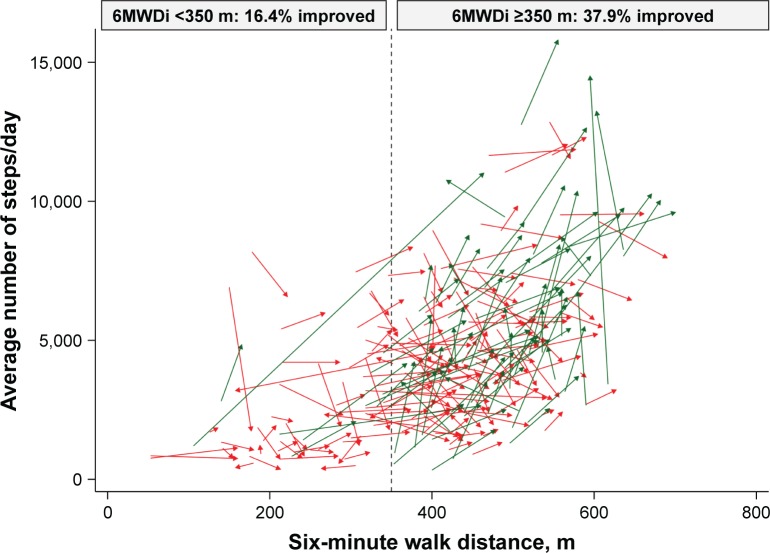
Figure 2.
Changes in PA levels and six-minute walk distance, according to group.
Notes: Green arrows denote improvement in PA ≥1,000 steps/day; red arrows denote change in PA <1,000 steps/day. Arrow tails reflect baseline function; arrow heads reflect function at 3 months. Vertical dashed line denotes 350 m cutoff for groups defined according to 6MWDi.
Abbreviations: PA, physical activity; 6MWDi, initial six-minute walk distance.

