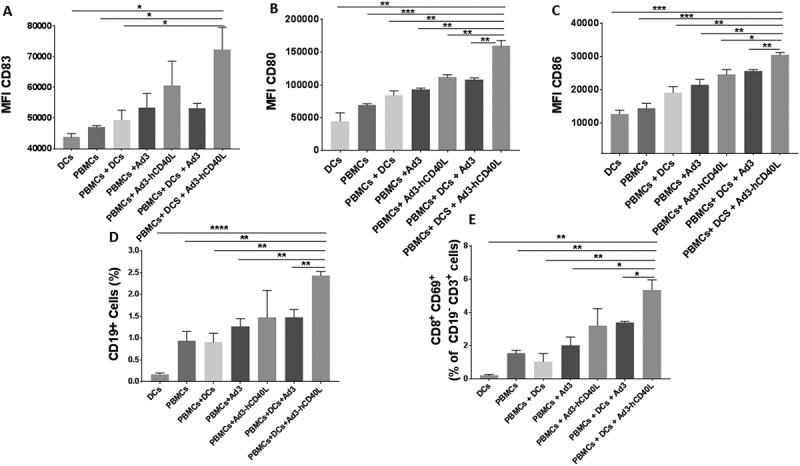
Figure 5.

Immune response in the tumor microenvironment. Median fluorescence intensity (MFI) for CD83 (A), CD80 (B) and CD86 (C) of CD11c± populations. Percentage of the CD19 + B cell population (D) and CD8+ CD69+ lymphocytes of the CD19-CD3+ parent population (E). Data is presented as mean ± SEM. *, P < 0.05 **, P < 0.01. ***, P < 0.001, ****, P < 0.0001.
