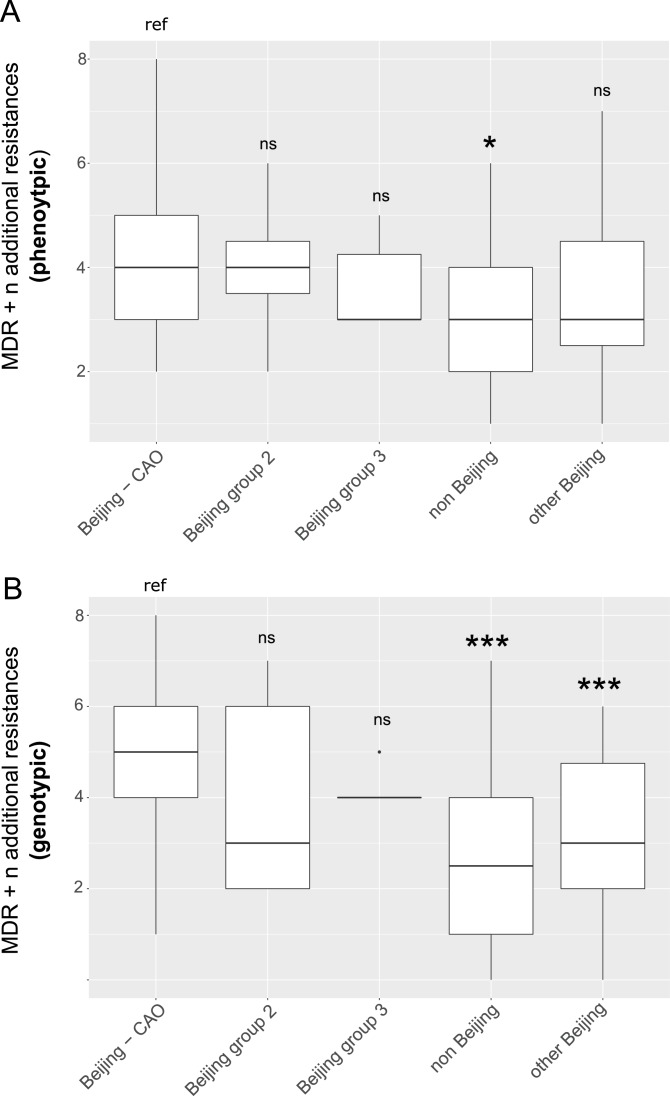
Appendix 1—figure 3. Box-Plot showing median number of (A) phenotypic and (B) genotypic drug resistances (in addition to the MDR classification,that is isoniazid and rifampicin resistance) of all isolates from Karakalpakstan.
Box represents inter quartile range, whiskers represent 95% of the data, outliers shown as black dots; solid black line represents the median. Beijing CAO isolates exhibit more phenotypic drug resistances compared to non-Beijing isolates (p=0.0079) and more genotypic drug resistances compared to other Beijing isolates (p<0.0001), and non-Beijing isolates (p<0.0001). P-values for pairwise comparison with reference group calculated with unpaired t-test (two-tailed, Welch’s correction).

