. 2018 Oct 30;7:e36275. doi: 10.7554/eLife.36275

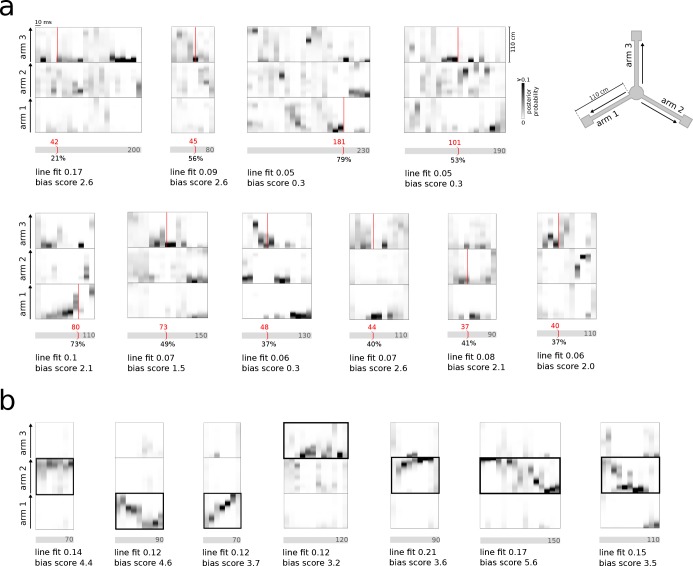
Figure 3. Real-time detection of replay content.

(a) Examples of reference single content replay events that were successfully detected online with correct identification of replay content (vertical red line). The gray bar below each plot represents the total event with duration (in ms) indicated inside the bar. The absolute detection latency from event onset is indicated in red above the bar and the detection latency relative to the duration of the event is indicated below the bar. (b) Similar to (a) but for joint replay events. All examples except the second show online detections triggered by the first replayed arm; the second example shows an online detection that was triggered by a replay of the second arm. (c) Similar to (a) but for reference bursts without replay content that were correctly ignored online.

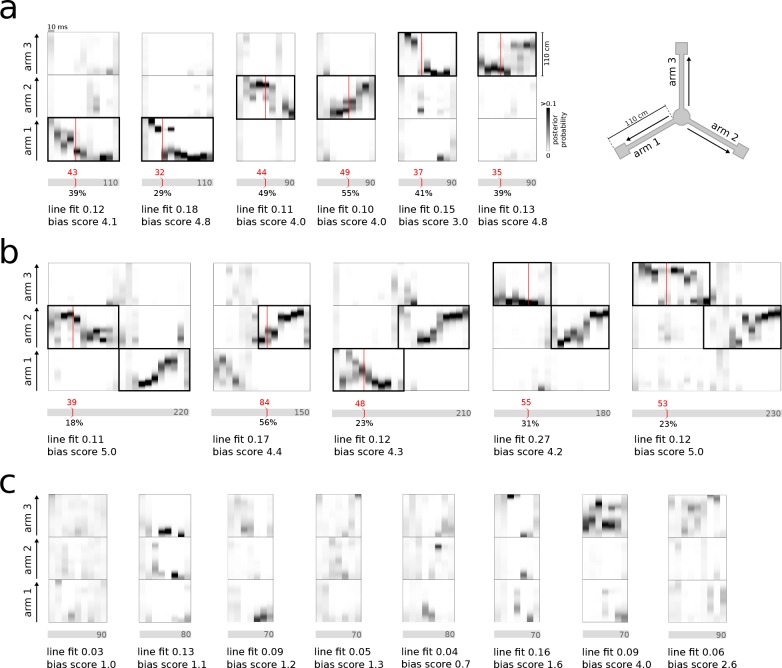
Figure 3.

Figure 3—figure supplement 1. Examples of incorrect online identification of replay.

Figure 3—figure supplement 1.

(a) Examples of false-positive detections. Most incorrect detections were due to spurious matching of the identification criteria in the 30 ms preceding window, without significant reference replay detected offline across the whole population burst. A smaller subset of false-positive detections were due to erroneous decoding of spiking activity (e.g. in the first two examples). (b) Examples of false-negative detections. In the first five events, individual identification criteria were met throughout the population burst but never concurrently. Other false-negative detections were caused by decoding errors (sixth example) or by an online detection that occurred just outside the event (last example).