. 2018 Oct 30;7:e36275. doi: 10.7554/eLife.36275

Figure 5. Parameter tuning of online replay detection for optimal detection performance.

(a) Map of the Matthews correlation coefficient for different combinations of values for θmua and θsharp of a REST (top) and RUN2 (bottom) epoch; the map was computed using offline playback simulations (dataset 2). Circles indicate the value corresponding to the actual parameters used in the online tests (open circle) and the value corresponding to the set of parameters that maximizes the Matthews correlation coefficient (filled circle). (b) Same as (a) for the non-burst detection rate for different combination of thresholds. Circles indicate the value corresponding to the actual parameters used in the online tests (open circle) and the value corresponding to the set of parameters that maximizes the Matthews correlation coefficient (filled circle).

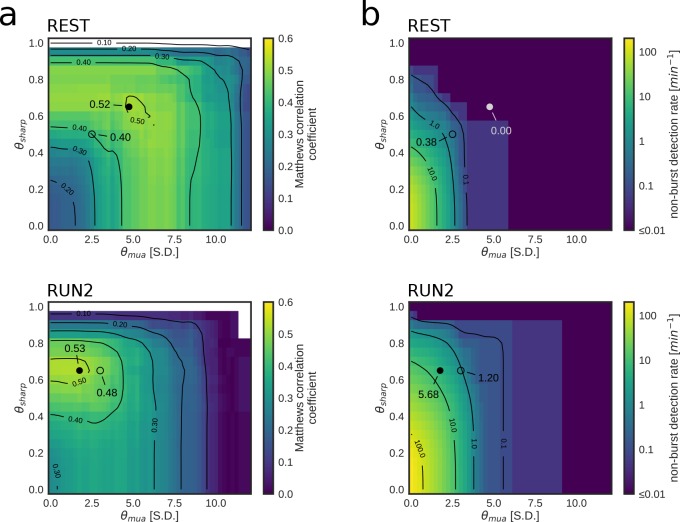
Figure 5.

Figure 5—figure supplement 1. Parameter tuning of the replay content identification algorithm for customized detection performance of a REST epoch.

Figure 5—figure supplement 1.

(a–f) Dependence of online replay detection performance indices on algorithm parameters tested using offline playback simulations with varying combinations of values for θmua and θsharp. Circles indicate the value corresponding to the actual parameters used in the online tests (open circle) and the value corresponding to the set of parameters that maximizes the Matthews correlation coefficient (filled circle). Note how lower values of both θmua and θsharp improve sensitivity, but negatively affect sspecificity and false discovery rate. On the other hand, median relative latency and content accuracy are not affected by parameter tuning as they depend on other elements of the replay content identification framework.
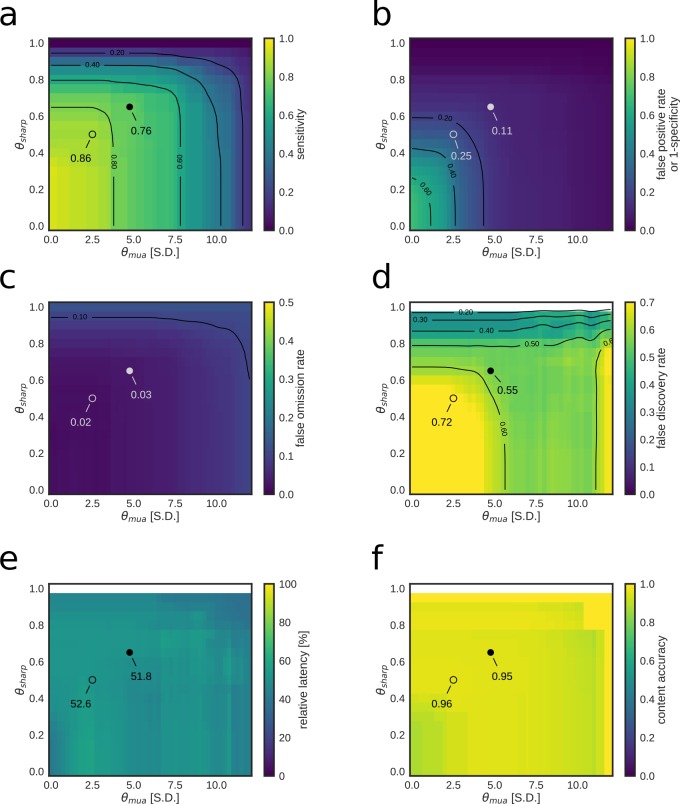
Figure 5—figure supplement 2. Parameter tuning of the replay content identification algorithm for customized detection performance of a RUN2 epoch.

Figure 5—figure supplement 2.

(a–f) Dependence of online replay detection performance indices on algorithm parameters tested using offline playback simulations with varying combinations of values for θmua and θsharp. Circles indicate the value corresponding to the actual parameters used in the online tests (open circle) and the value corresponding to the set of parameters that maximizes the Matthews correlation coefficient (filled circle). Note how lower values of both θmua and θsharp improve sensitivity, but negatively affect specificity and false discovery rate. On the other hand, median relative latency and content accuracy are not affected by parameter tuning as they depend on other elements of the replay content identification framework.
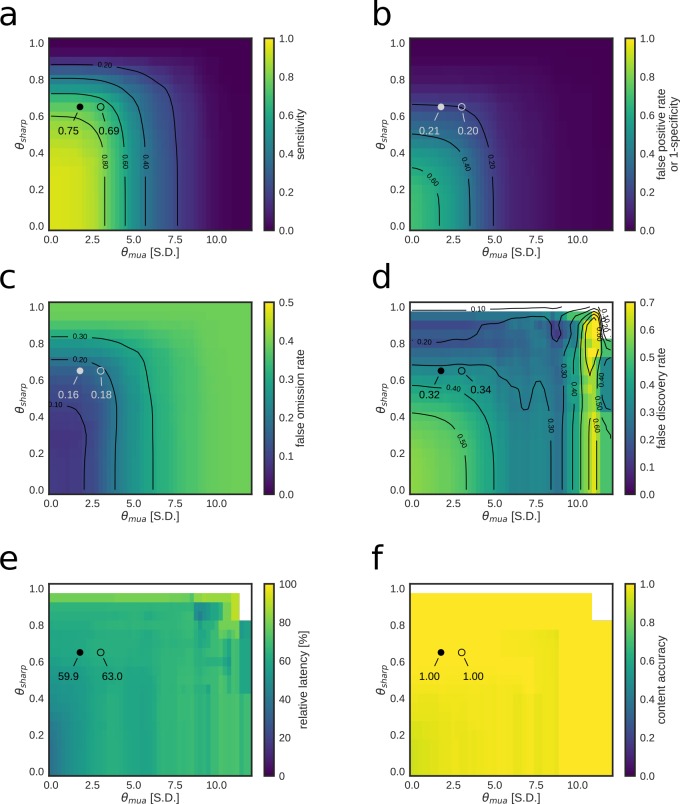
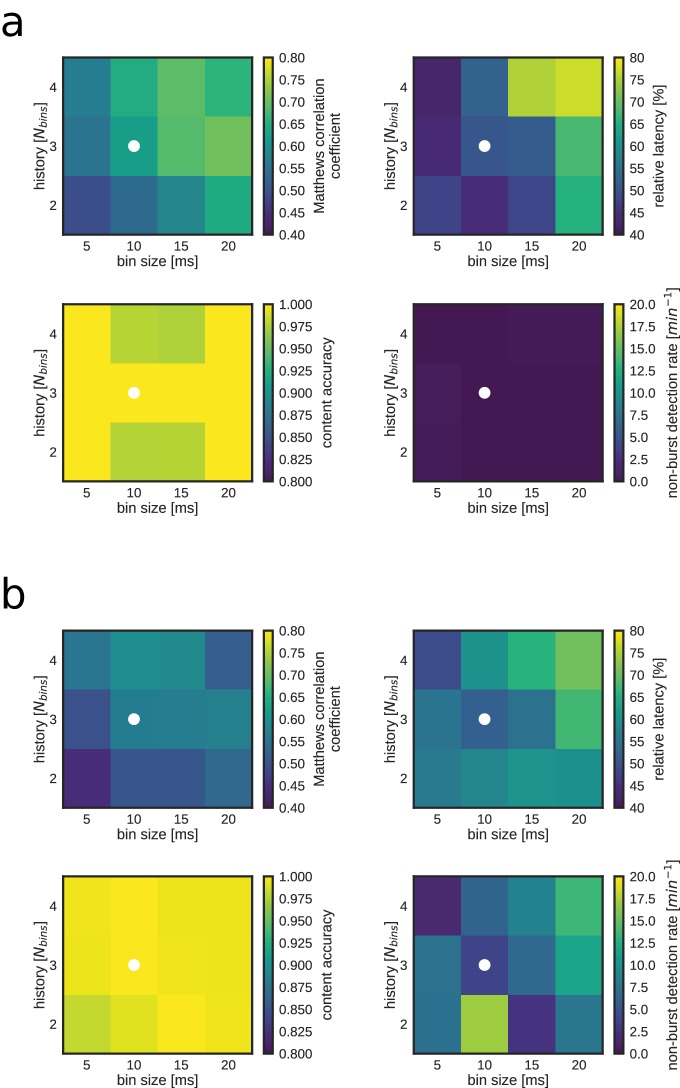
Figure 5—figure supplement 3. Replay identification performance as a function of time bin size and number of bins (Nbins) for both a REST (a) and RUN2 (b) epoch.

Figure 5—figure supplement 3.

Note that larger Nbins and/or bin size result in both an improved detection performance (i.e. higher Matthews correlation coefficient; top left) and worse detection latency (bottom left). The white dot indicates the combination of bin size and Nbins used for online detections and most offline analyses.