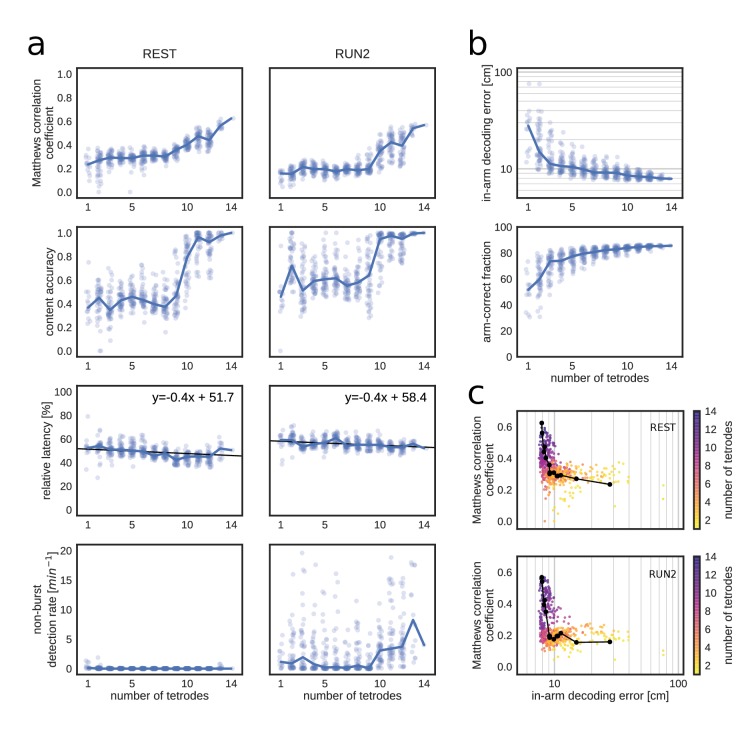
Figure 6. Matthews correlation as a measure of replay identification performance as a function of the number of tetrodes included (up to 50 random selections per tetrode number).
(a) Matthews correlation coefficient, content accuracy, relative detection latency and non-burst detection rate for REST (left) and RUN2 (right). Dots represent individual tests, lines represent the median. (b) Cross-validated RUN1 decoding performance as a function of the number of tetrodes. Top: median in-arm decoding errors. Bottom: fraction arm-correct position estimates. (c) Scatter plot of the relation between median in-arm decoding error and replay detection performance during REST (top) and RUN2 (bottom). Black lines represent the centroid for each color-coded number of tetrodes in vivo.


