
Fig 1.
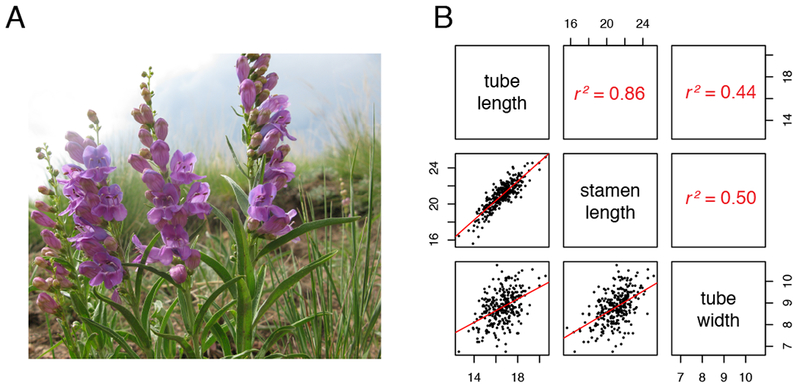
A: Representative individuals from the P. virgatus study population. B: scatterplots of pairwise floral dimension traits. Each dot is an individual plant and red lines show linear regression. Pearson’s correlations are reported above the diagonal.