
Fig. 3.
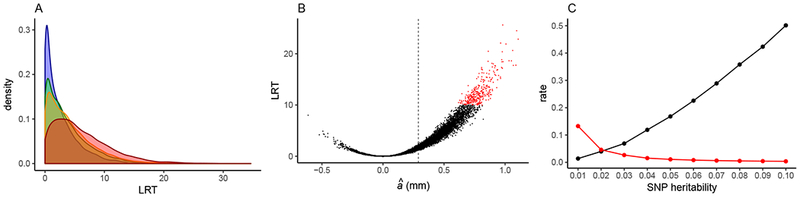
Estimated genetic effects from simulations of our genome-wide scan. Parameter values are given in text. A: Density plot showing distributions of likelihood ratio test statistic (LRT) values for 10,000 simulations of each of four modeled datasets: model of our empirical dataset (blue), doubled average read depth (green), doubled sampled individuals (orange), complete and error-free genotype data (red). B: Scatterplot showing the relationship between estimated additive effect (â) and LRT for each of 10,000 replicate simulations of our empirical dataset. Sites with LRT > 10 are in red and the simulated additive effect size (0.29 mm) is indicated with dashed line. C: Rate that a true positive is detected (black) and false positive rate (red) for SNP heritabilities ranging from 0.01–0.10.