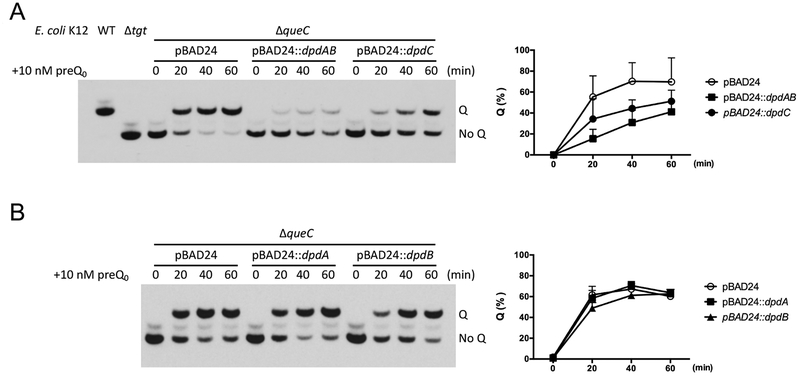
Figure 6. Overexpression of DpdC in E. coli K12 reduces the rate of Q formation in tRNAASP.
(A) (Left) The formation rate of Q was estimated by visualizing tRNAASPGUC extracted at different time points (0, 20, 40 and 60 min) after supplementing with preQ0. tRNA extracted from WT and Δtgt strains were used as control. (Right) The density of the bands was measured by ImageJ (Rueden et al., 2017). The percentage of Q modified tRNAASPGUC was plotted. The average of three experiments is shown, with error bars representing SD. (B) The effect of expression of DpdA and DpdB on the Q formation rate was estimated with the same approach.

