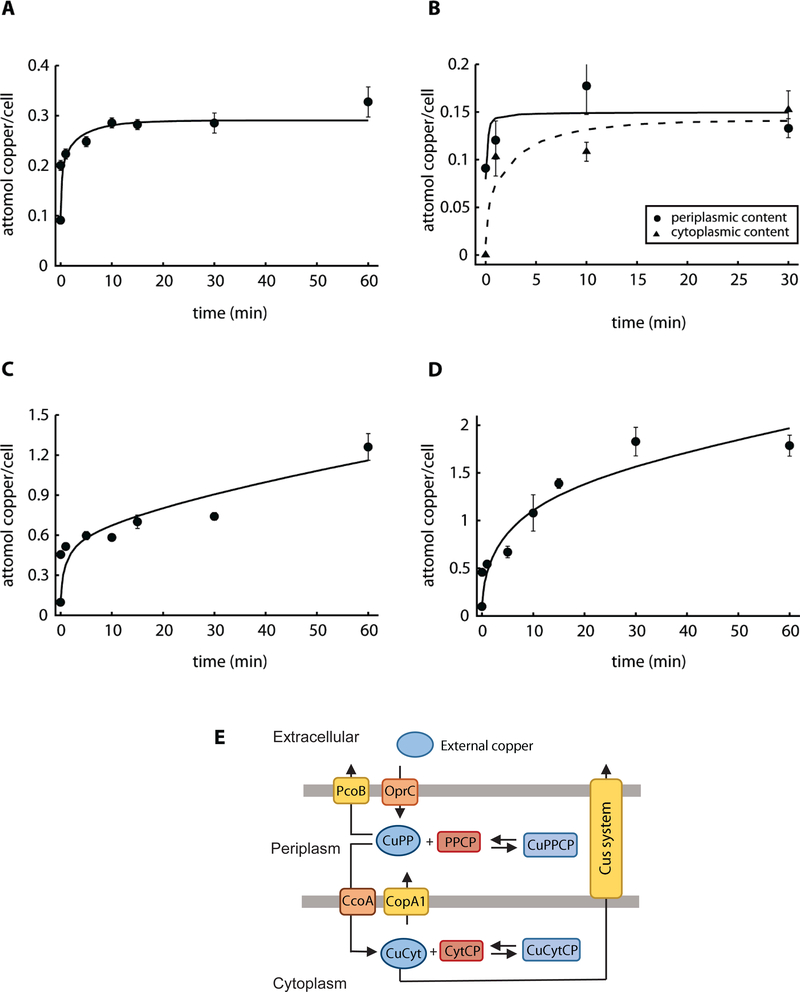
Figure 1. Experimental data and best fit by Model I.
A) Copper uptake kinetics in the presence of 0.5 mM CuSO4 (Quintana et al. 2017). B) Compartmental distribution of copper levels 1, 10 and 30 min after the addition of 0.5 mM CuSO4, solid line is for periplasmic and dashed line is for cytoplasmic fraction. C, D) Copper uptake kinetics in the presence of 2 mM and 4 mM CuSO4. Solid lines represent the best fit to the data using Model I (parameter values in Table 1). Experimental data are the mean ± standard error of 3 independent replicates. E) Parsimonious model of copper uptake kinetics in P. aeruginosa PAO1 (Model I). CuPP, periplasmic copper bound to chaperones, and CuCyt, cytoplasmic copper bound to chaperones. PPCP, periplasmic and outer membrane proteins; CytCP cytoplasmic and inner membrane proteins. Equilibrium copper binding is represented by arrows pointing both ways. Single arrows represent the direction of transport.

