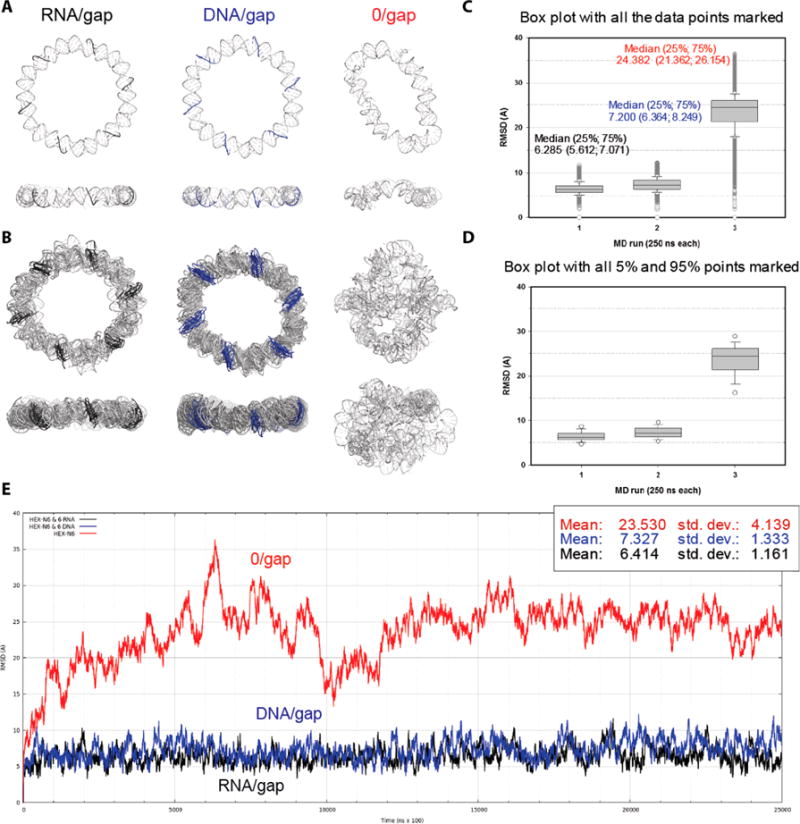
Figure 2.

Results of molecular dynamics (MD) 250 -ns-long simulations of the gapped hexagonal ring nanostructures. (A) Minimized average structures for the entire MD simulations for (left to right) the ring with RNA complementary strands (black), the ring with DNA complements (blue), and the gapped ring without the complementary strands. (B) Overlays of the selected RMSD peak structures capturing the extents of distortions experienced in the MD simulations by the ring model variants explained in A. (C, D) Box plots of the RMSDs for the three ring models. All data points are plotted in C, while only the 5 and 95% points outside the 25−75% boxes are marked in D. The median values are shown with the 25 and 75% values (bottom and top of the boxes, respectively) listed in parentheses. All differences in the medians are statistically significant according to the Mann−Whitney rank sum test. (E) RMSD plots calculated relative to the first frame of each MD simulation for the C4′ backbone atoms shared with the gapped dumbbells (6 × 38 atoms) (i.e., excluding the single-strand data in the fully complemented ring models).
