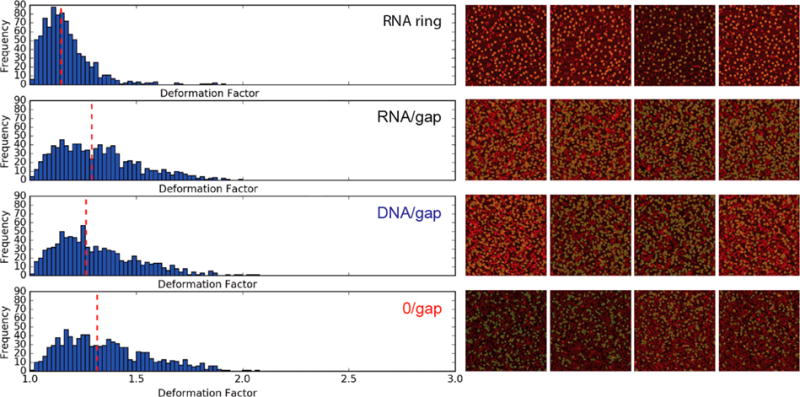
Figure 5.

Computational algorithmic deformation analysis. Shown on the left panel are the deformation factor (DF) histograms for four types of nanostructures (top to bottom): RNA ring, RNA/gap, DNA/gap, and 0/gap rings. Median deformation factors are measured to be ∼1.14, ∼1.28, ∼1.26, and ∼1.32, respectively. We have manually defined the roundness cutoff at 0.6 in order to allow for variations in object shape but preclude very deformed shapes from being selected (Figure S6). Shown on the right is a visual representation of the AFM images with colored nanostructures selected by the algorithm and included in the deformation analysis. Figure S5 shows that the comparative trends among four types of nanostructures remain stable for different roundness cutoffs.
