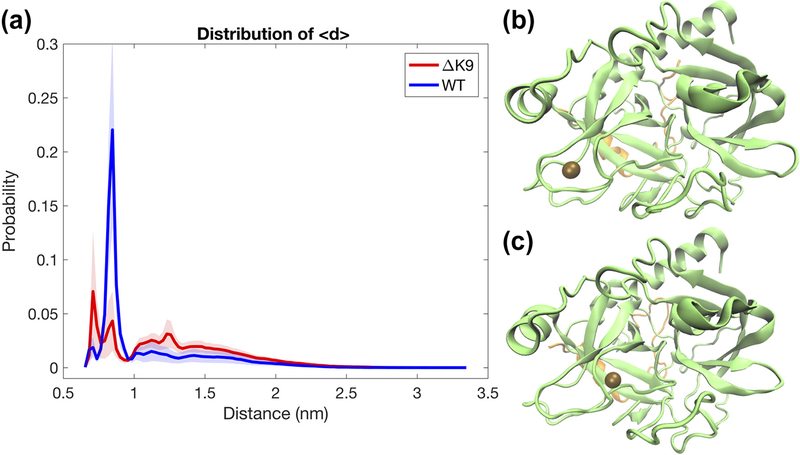
Figure 6.
Distribution of the distance between the sodium loop and the nearest Na + ion. The wild-type (WT) and ΔK9 mutant thrombin present two striking peaks representing Na + binding in the distribution plot (a). The peaks at 7 Å and 8.5 Å correspond to two binding modes of Na + as respectively illustrated in panel (b) and (c), where the bound Na + ion is shown as the brown bead.

