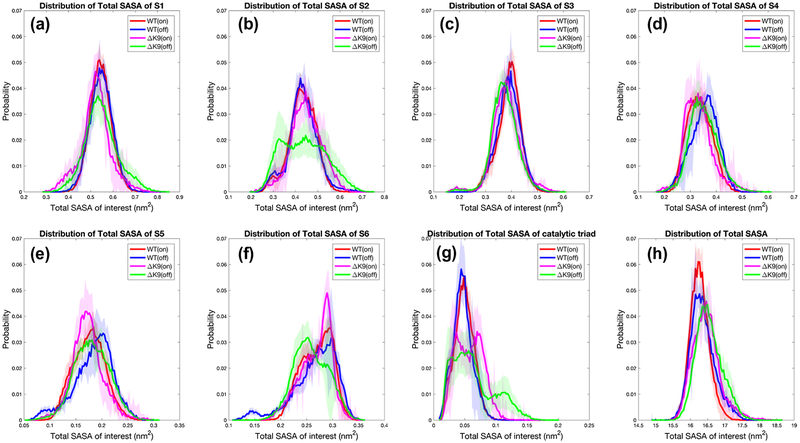
Figure 7.
Distributions of solvent accessible surface area (SASA). Regarding conformations with a bound/unbound Na {+} ion (denoted as on/off), the SASA distribution of the catalytic sub-pocket S1–6 residues are plotted respectively for wild-type (WT) and ΔK9 mutant thrombin in panels (a)-(f). The SASA distribution of the catalytic triad and the SASA of the whole protein are also plotted in (g) and (h).

