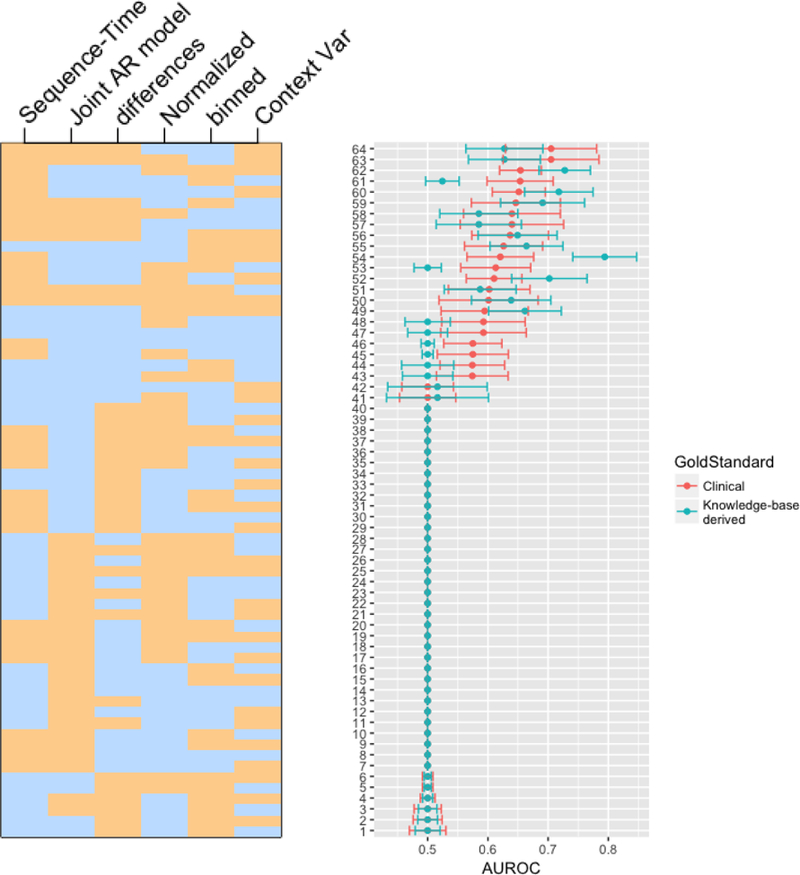
Figure 4.

This figure displays AUROC confidence intervals for each of 26 methodological combinations. AUROCs are ordered from top-to-bottom in descending order of AUROC from the expert-curated gold standard. The heatmap on the left indicates the presence (tan) or absence (blue) of each of the 6 method variables for each plotted AUROC. For example, the top AUROC method (according to the clinically-curated gold standard) used sequence-time, no binning, intra-patient normalization, differencing, no additional context variable, and a joint AR model. Note that these results are enumerated explicitly in Supplementary Table 1.
