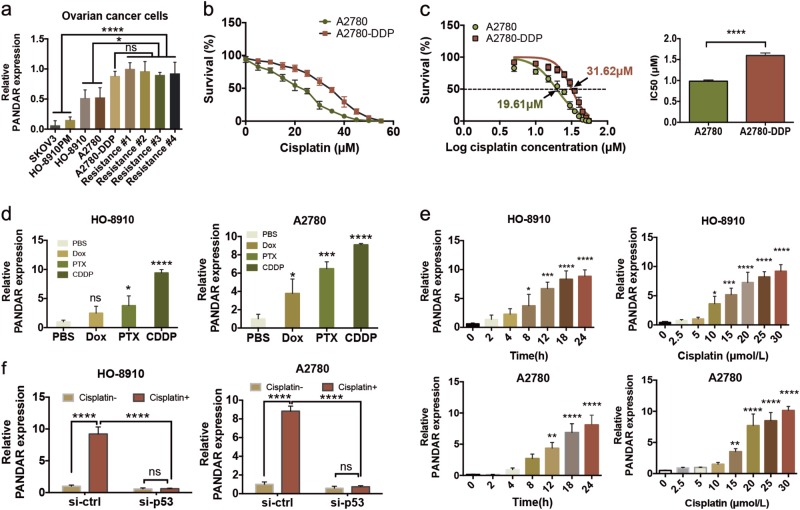
Fig. 1. Inverse association between PANDAR-expression and cisplatin sensitivity in ovarian cancer cells.
a QRT-PCR analysis of PANDAR expression in the chemosensitive ovarian cancer cell lines, A2780 cisplatin-resistant cell lines (A2780-DDP) and primary recurrent ovarian cancer cells of the 3rd generation. b CCK-8 assay of cell survival rate in A2780 and A2780-DDP cells after treated with an increasing dose (0–55 μM) of cisplatin for 24 h. c The half maximal inhibitory concentration (IC50) was calculated from Fig. 1b via three independent experiments using GraphPad 6.2 software. d QRT-PCR of PANDAR expression in A2780 and HO-8910 cells after treated with phosphate buffer saline (PBS, 5 µM), doxorubicin (DOX, 5 µM), paclitaxel (PTX, 25 nM), or cisplatin (CDDP, 20 µM) for 24 h. PBS serves as control. e PANDAR expression in A2780 and HO-8910 cells after treated with 20 µM cisplatin for indicated time (left) or treated with indicated concentrations (right) of cisplatin for 24 h. f PANDAR expression in A2780 and HO-8910 cells with TP53 silenced after treated with or without 20 µM dose of cisplatin for 24 h. Vehicle groups were treated with PBS. PBS groups are normalized to 1. Data presents the mean ± S.D. *p < 0.05, **p < 0.01, ***p < 0.001, ****p < 0.0001, ns non-significant. Two-tailed Student’s t-test. n = 3 independent experiments

