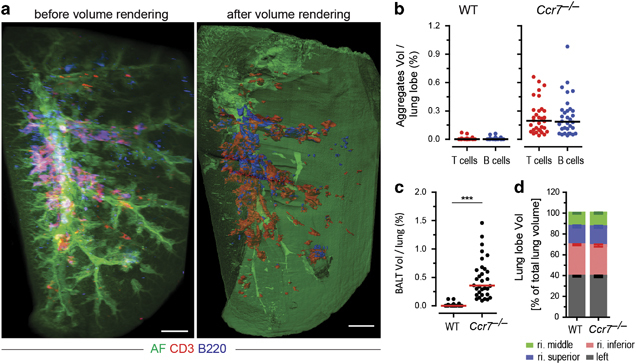
Figure 3.

Quantification of bronchus-associated lymphoid tissue (BALT) in light sheet microscopy (LiSM)-imaged lung lobes. (a) Surface renderings of antibody-stained and LiSM-imaged lung lobes isolated from a Ccr7 −/− mouse, using Imaris software, to determine the volume of T-cell (anti-CD3, red) and B-cell (anti-B220, blue) aggregates, which were subsequently used to calculate the volume of BALT within lobes. (b) Percent volume of T- and B-cell aggregates per lung lobe quantified in WT (left) and Ccr7 −/− (right) mice. (c) Percent volume of BALT per lung lobe quantification in WT and Ccr7 −/− mice. (d) Relative volume of whole lung lobes from WT and Ccr7 −/− mice. Individual lung lobe volume was calculated as the percent of the sum of left, right inferior, right superior and right middle lobes. For quantitative analysis, eight mice were included per group, with at least six independent experiments performed. Bars represent median values; ***P<0.001. AF=autofluorescence. Scale bars=500 μm.
