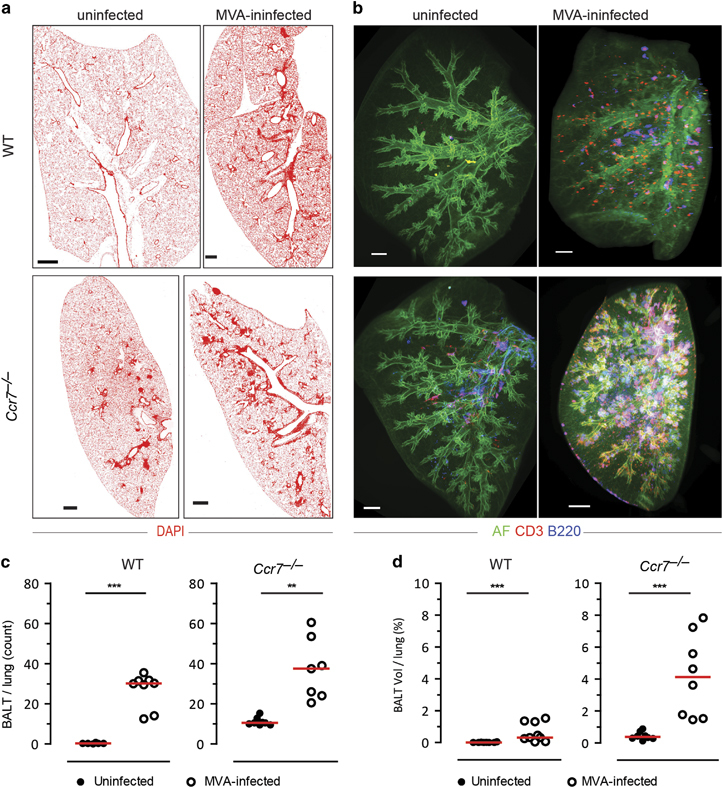
Figure 4.

Comparing qualitative and quantitative analysis of modified vaccinia virus Ankara (MVA)-induced bronchus-associated lymphoid tissue (BALT) between immunohistology and light sheet microscopy (LiSM). (a) Representative immunofluorescence micrographs of WT and Ccr7 −/− lung cryosections from uninfected or MVA-infected mice (12 days post-infection), stained with DAPI (red). (b) Representative LiSM micrographs of WT and Ccr7 −/− lung lobes from uninfected or MVA-infected mice (12 days post-infection) stained with anti-CD3 (red) and anti-B220 (blue) antibodies. (c) Quantitative analysis of the amount of BALT per lung (mean value of 4 sections per lung) from uninfected or MVA-infected WT and Ccr7 −/− mice (WT, uninfected n=6, MVA-infected n=8; Ccr7 −/−, uninfected n=8, MVA-infected n=7). (d) Quantitative analysis, using Imaris software, of the percent volume of BALT per lung (mean value of left lobe, right inferior lobe, right superior lobe and right middle lobe per lung) from uninfected or MVA-infected WT and Ccr7 −/− mice (WT, uninfected n=8, MVA-infected n=9; Ccr7 −/−, uninfected n=8, MVA-infected n=8). For quantitative analysis, at least 6 independent experiments were performed. Bars represent median values; **P<0.01; ***P<0.001. AF=autofluorescence. Scale bars=500 μm.
