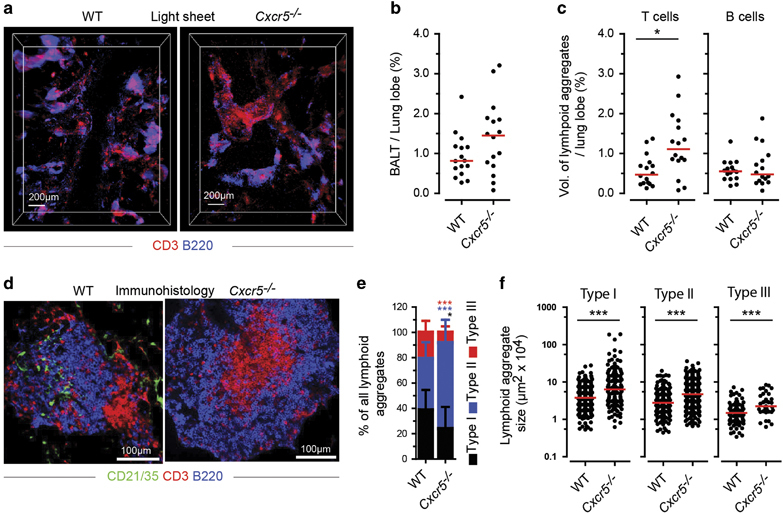
Figure 6.

Qualitative and quantitative comparison of E. coli-induced bronchus-associated lymphoid tissue (BALT) in wild type (WT)and Cxcr5 −/− mice. (a) Representative light sheet microscopy (LiSM) micrographs showing the distributions of T and B cell aggregates in the lung on day 18 following E. coli infection. Micrographs were taken from lung lobes stained with anti-CD3 (red) and anti-B220 (blue). (b) Quantitative analysis, using Imaris software, showing the volume of the whole lung lobe occupied by BALT; comparison between WT and Cxcr5 −/− mice. (c) Quantitative analysis of T- and B-cell aggregates in whole lung lobes; comparison between WT and Cxcr5 −/− mice. Data (b, c) was collected from 4 WT and 4 Cxcr5 −/− mice, in which four lung lobes were analyzed per mouse from at least 3 independent experiments. (d) Representative immunofluorescence micrographs taken from lung cryosections of WT and Cxcr5 −/− mice on day 18 following E. coli infection. Cryosections were stained with anti-CD21/35 (green), anti-CD3 (red) and anti-B220 antibodies. (e) Relative frequency of type I, type II and type III lymphoid aggregates on day 18 following E. coli infection of WT and Cxcr5 −/− mice. (f) Sizes of type I, type II and Type III lymphoid aggregates quantified on day 18 following E. coli infection of WT and Cxcr5 −/− mice. Data (e, f) were collected from 7 WT and 4 Cxcr5 −/− mice, in which 4 lung cryosections were analyzed per mouse from at least 3 independent experiments. Bars (b, c, f) represent median values; error bars (e) represent means±s.d.; *P<0.5; ***P<0.001. The color of stars (e) relates to the type of aggregate, as indicated.
